Sunday, September 30, 2012
Trout Becomes Youngest Ever To Get 30+ HRs & 30+ SBs In A Season
Saturday, September 29, 2012
Torii Hunter May Make The Top 10 in WAR For The First Time At Age 36
He has 5.1 and 10th place has 4.7 (Pujols). So with only 5 games left, it looks like he will make it. His highest WAR before this was 5.0 in 2009.
For ages 36 and older, a WAR of 5.0 or higher has only been reached 47 times. Randy Velarde was 4th in the AL in 1999 with a 6.7 at age 36. It was his only top 10 finish ever. I think his next best year was 3.2.
Al Oliver made it for the first time in 1982 at age 35. He was 10th in the NL with 5.7.
Chipper Jones Is In A League All By Himself
Friday, September 28, 2012
Through 1990, Who Were The Only 3 Players With 1000+ RBIs, 250+ HRs, 250+ SBs and 2500+ Hits?
I did this search because a question came up in the Hornsby chapter of SABR. Who are the only two guys with 1200+ RBIs, 250+ HRs, 300+ SBs and 3000+ Hits?
Answer: Willie Mays, Joe Morgan and Vada Pinson
Thursday, September 27, 2012
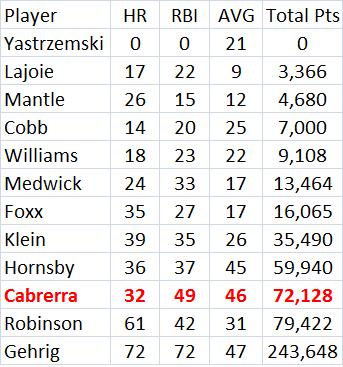
Who Was The Most Surprising Triple Crown Winner?
A player would get 10 points for each time he led his league in HRs, 9 for a 2nd place, etc. The same was done for AVG and RBIs. So the player had a career total number of points for each stat. A tie for 1st was still worth 10 points. Then those three numbers were multiplied times each other (meaning if a player never finished in the top 10 in one of these stats, his total will be zero).
So Yastrzemski was the most surprising. He did not make the top 10 in either HRs or RBIs in his six seasons before he won the triple crown (he was also the least likely to win using career data since 1900). Cabrerra would not be that big of a surprise, especially considering that he has led the league in all three stats in different years already. Gehrig was not a surprise at all he had been in the league leaders for several years in all three stats many times. Maybe his age of 31 made it a little more surprising. But it is not like his career was in decline before that.
Monday, September 17, 2012
Is DeWayne Wise?
Tuesday, September 11, 2012
Chris Sale vs. Stephen Strasburg

BR means Baseball Reference and FG means Fangraphs. I don't know why they are so different on WAR. I also don't know if FIP, xFIP, Sierra and tERA are park adjusted. It looks like BR gives Sale about a 106 for pitching in U.S. Cellular Field and Strasburg does not seem to get adjusted much, so his park must be neutral. So for the league %'s on FIP, xFIP, Sierra and tERA, we could multiply what Sale has by about .94. He would still be higher than Strasburg, but a little closer.
Sunday, September 9, 2012
Trout's Season Now In Top 50 In WAR
Update: Through games of Sept. 10, he is at 10.2. That is tied for the 28th best season ever. Fangraphs has him at "only" 8.6. But that is just in 118 games. If he did that for 162 games, it would be 11.8, good enough for the 23rd best season ever at Fangraphs. Over 154 games, it would be 11.2, tied for the 32nd best season ever. Going back to Baseball Reference, if Trout kept up his pace this year for 162 games, he would have 14 WAR, beating Ruth's record of 13.7 in 1923. Over 154 games. Trout would get 13.3 and that would be 2nd to Ruth. If Trout keeps up his current pace over the last 21 games, he will finish with a WAR of about 12. That would tie Hornsby and Yastrzemski for the 4th best season ever. Trout had one game where he pinch ran in the 8th inning and the game ended in the 9th. He had no putouts or PAs or SBs.
Update: Through games of Sept. 11 he is at10.4, tied for the 24th best season ever with Yount (1982) and Bonds (2004). If he can make it to 11.4, he will crack the top 10. Not too easy, since it would be a WAR of about 1.0 in 20 games or 8 for a full season. He is obviously capable of that, of course.
Update: Through games of Sept. 20 he is at 10.1. Over his last 8 games, he has been .3 below replacement. He was 6 for 30 in those 8 games with just 1 extra-base hit (2B), 5 BBs and 1 SB.
Update: Through games of Sept. 22 he is at 10.4.
Update: Through games of Sept. 26 he is at 10.6. That is tied for 22nd with Ty Cobb (1911) and Rogers Hornsby (1921). Trout has only played 132 games this year. Only 12 players have ever had a season of 10.6 or higher before Trout. They are
Ruth
Bonds
Ripken
Yastrzemski
Wagner
Morgan
Gehrig
Mantle
Hornsby
Musial
Williams
Mays
Update: Through games of Sept. 27 he is back down to 10.5. So he falls to 24th place.
Update: Through games of Sept. 28 he is back down to 10.4 even though he was 2 for 5 with a HR and a 3B. So he falls to a tie for 24th place.
Update: Through games of Sept. 30 he is back up to 10.5. The Angels played a doubleheader on Sept 30 after being rained out the day before.
Update: Through games of Oct. 1 he is up to 10.7. That is tied for 20th with Mays (1964) and Williams (1946)
Wednesday, September 5, 2012
One Possible Key To The Orioles
In the AL this year the overall batting OPS is .733. In CL situations it is .683. So the Orioles only drop off .035, not the norm of .050. For AL pitchers, the overall OPS allowed is .729. In CL cases it is .674. So the Oriole drop off is .126 while it is just .055 for the league.
In non-CL situations the Orioles have about a .727 OPS and their pitchers allow a .747 OPS. Here is my formula for predicting winning pct. using non-CL OPS and CL OPS (both for batters and what is allowed)
PCT = 0.501 + 0.918*NONCLOPS + 0.345*CLOPS - 0.845*OPPNONCLOPS - 0.421*OPPCLOPS
That would give them a .526 Pct. Then they should have 71 wins but they really have 76. So there are still 5 wins not explained.
Baseball Reference gives the Orioles hitters a clutch rating of 2.9, meaning that they tend to hit better the more runners on base, the closer the score and the later the game. So they have won 2.9 more games than you would expect from their hitting than you would normally expect. Pitchers have 6.8. That adds up to 9.7. If they were to win only half their games, it would be 67.5. But if you add 9.8 to that you get 77.3. Very close to their actual win total of 76. They just perform better when it matters more.
Sunday, September 2, 2012
Chipper Jones In Rare Company With 1000+ Extra-base Hits, 1000+ Wallks And A .300+ AVG

Wednesday, August 29, 2012
Mike Trout's Season Is Now In The Top 100 Of All-Time And It Looks Like It Is Now The Greatest Rookie Season Ever
Click here to see the rookie list.. I think Joe Jackson has the previous best rookie season at a WAR of 9.0.
Update: Through Aug. 30, Trout has slipped to 8.9 WAR
Update: Through Aug. 31, Trout is up to 9.2 WAR
Tuesday, August 28, 2012
Who Was The Greatest "All-Around" Player Ever? Another Quantitative Attempt (Part 3)
I have already used both a triples stat and then a SB stat to measure speed. Here I combined them. I used the square root of the SB stat (see earlier posts for how that worked). Then that was added to the triples stat and I simply took the average of the two. One reason I took the square root of the SB stat is that it had a very large range and this brings it more in line with the other stats. This is actually similar to what Bill James does with his "speed score." One of his stats in that involves SBs and he takes the square root of it. He also uses triples. But I don't use fielding range factor, partly because it would be hard to get it for each guy but also I am already using fielding here. I don't uses CS or GIDP since we don't have them for all of history. I don't use runs scored since that depends on your teammates.
So here is the top 25.

Here are the numbers for Mays. Recall that they are relative to the leage average:
Fielding: 1.13
Isolated Power: 1.89
Average: 1.14
Speed: 1.49
Mays got a slight bumb from the park adjustment (an increase of 2%). For the above replacement level version here are the leaders (this was done the same way as in the first two posts). Mays has a solid lead. He has been the best or near the top so far in all the ways I have looked at this.

http://cybermetric.blogspot.com/2012/08/who-was-greatest-all-around-player-ever.html
Thursday, August 23, 2012
Who Was The Greatest "All-Around" Player Ever? Another Quantitative Attempt (Part 2)
In this case, I used a stat for stolen bases for speed instead of the one for triples. Because of that, the isolated power stat here was not adjusted for triples like I did the first time. The stolen base stat is SBs divided by number of times reaching first base (singles + walks + HBP). That was then divided by the league average. The next post I do will combine triples and SBs to make a speed stat. I think that neither a SB stat nor a triples stat are good enough by themselves.
So here is the new set of leaders. The 1.57 for Bobby Bonds means that the geometric average of the 4 stats was 1.57. If, for example, he had been 57% better than the league average in each of the 4 stats, his geometric average would have been 1.57. His stats were actually
Fielding: 1.08
Isolated Power: 1.63
Batting Average: 1.03
SBs: 3.41
He was 8% better at fielding. His SB rate was 3.41 times the league average.

Willie Mays once again does extremely well (Bobby Bonds was 23rd before). He was 3rd in the other measure using 3Bs for speed. DiMaggio was first. But here he fell to 449th. His stealing rate was only .37. Rickey Henderson rose from 284th place since he did not have very many triples (he was just about average). So some players moved up or down in the rankings quite a bit. The SB rate had a bigger range than the SB rate (although the correlation between the two rates was about .56). It went from 5.35 down to 0.019. The triple rate ranged from 3.85 down to 0.197.
I also calculated an "above replacement" level value, using the same method as last time. Here is the top 25. I don't think the number has any real meaning or interpretation. This just allows us to take into account longevity and the typical decline in performance that we normally see. Mays was 1st in this one last time. Mays probably would gain on Henderson if I could split fielding into throwing and catching (which I will try to do at some point). Would it be enough to pass Henderson? If so, I think it would strengthen the case for Mays being the greatest all around player ever since he ranks so high using either SBs or 3Bs for speed.

Wednesday, August 22, 2012
Major League Baseball Could See Its 500,000th Error This Season!
There have also been 98,790 hit batters, so that could be passed in a couple of years.
Update: Jose Reyes made the 500,000th error on Sept. 15th. See Marlins' Jose Reyes fumbles way into history with baseball's 500,000th error by Jeff Passan. It also has a video clip.
Does Mike Trout Already Have The 2nd Highest WAR Ever For A Rookie?
He leads the 2nd best position player in the league, Robinson Cano, by 3.0 (Cano has 5.6). The last time a position player was 3.0 or more better for a whole season than the 2nd best position player was in 2002 when Barry Bonds had 11.6 and Jeff Kent had 6.9.
Tuesday, August 21, 2012
Is Alexei Ramirez A Good Offensive Player?
2008-104
2009-86
2010-99
2011-94
2012-72
His career OPS+ is 92. His career OBP is .317 and this year it is .282. He is not making up for it with base stealing. He does have 14 SBs with only 5 CS this year. But that is of marginal importance and in his career his SB-CS is 61-32.
Monday, August 20, 2012
Is Mike Trout Only The 6th Player To Have 20+ HRs and 35+ SBs In His First 100 Games Of A Season?
Cesar Cedeno-1974
Joe Morgan-1976
Rickey Henderson-1985, 1990
Eric Davis-1986, 1987
Barry Bonds-1990
Let me know if you think I missed anyone. Trout has a good chance to get 30+ HRs and 50+ SBs. Only two players have ever done that, Barry Bonds and Eric Davis, each once.
Thursday, August 16, 2012
Update On Mike Trout's Historic WAR Per Game
Wednesday, August 15, 2012
How Much Will The Loss Of Cabrera Hurt The Giants?
Thursday, August 9, 2012
Who Was The Greatest "All-Around" Player Ever? Another Quantitative Attempt
Here is what Wikipedia says about it: "A geometric mean is often used when comparing different items- finding a single "figure of merit" for these items- when each item has multiple properties that have different numeric ranges." In fact, some of the values I will be using will have much larger ranges than others.
Here are the measures I will use:
Fielding: I use FRAA from the Lee Sinins Complete Baseball Encyclopedia (fielding runs above average). Sinins got them from Michael Humphreys' recent book Wizardry. I don't have a way of easily breaking this down into throwing (arm) and catching (glove), but I have something in mind that I will use in a future post. I converted it into a rate relative to the league average (like 1.10 means that you saved 10% more runs than average).
Hitting for Average: I will use average relative to the league average.
Hitting for Power: I will use isolated power relative to the league average.
Speed: I use a player's 3B/(2B + 3B) relative to the league average. This is an idea from Voros McCracken. The idea is that it is a % of the time you hit an extra-base hit that you get a 3B. The faster players will have a higher rate here. It is relative to the league average. Handedness is adjusted for. Triples were taken out of the relative isolated power calculation (for both the player and the league average) since they get used in the speed rating. Actually, for isolated power they were considered doubles. Both the speed and power ratings had ranges far beyond those of fielding and hitting for average.
A park adjustment was also made to each player's overall rating (this was based on hitting only).
The four ratings, each relative to the league average, are multiplied times each other and then I take the 4th root of that number (the geometric mean). I used all players who had 5000+ PAs through 2011. The table below shows the top 25.


Tuesday, August 7, 2012
Chris Sale vs. Stephen Strasburg

Sunday, August 5, 2012
Mike Trout's WAR Per Game Is Historically One Of The Best (So Far)

Thursday, August 2, 2012
Are Darwin Barney And Brendan Ryan Having Historic Fielding Seasons?
1. Terry Turner-5.4-1906
2. Art Fletcher-5.1-1917
3. Mark Belanger-4.9-1975
4. Ozzie Smith-4.7-1989
So far this year, after Barney and Ryan, the next highest defensive WAR belongs to Yunel Escobar of the Blue Jays with 2.2
Wednesday, August 1, 2012
Does Mike Trout Already Have One Of The Top Ten Rookie Seasons Ever?

Friday, July 20, 2012
Doubles As A Percent Of All Hits Over Time


The trend has also been to a higher frequency of doubles. See The Fastest Players Since 1900 According to the Triple-to-Double Ratio
Friday, July 13, 2012
Why Are The Red Sox Just a .500 Team If They Have a +47 Run Differential And An OPS Differential of +.039?
Here is what I posted at "Baseball Musings."
"They actually hit well with runners on base and RISP. Here are their BA-OBP-SLG-OPS with
RISP) 0.283 0.359 0.458 0.817
None on) 0.260 0.313 0.425 0.738
ROB) 0.279 0.349 0.463 0.813
Now their overall BA-OBP-SLG-OPS and in close and late situations
Overall) 0.268 0.329 0.441 0.770
CL) 0.241 0.310 0.383 0.693
How can a team which hits so well with runners on base do so poorly when it is close and late? Are they at a platoon disadvantage? Just bad luck?
Now the same thing for their pitchers
RISP) 0.256 0.343 0.432 0.775
None on) 0.265 0.341 0.431 0.772
ROB) 0.251 0.306 0.395 0.701
So it looks like their pitchers do much worse with runners on base.
Now their overall BA-OBP-SLG-OPS and in close and late situations
Overall) 0.257 0.321 0.410 0.731
CL) 0.271 0.335 0.403 0.738
So their pitchers do worse when it is close and late.
Overall, they have an OPS Differential of .039 (.770- .731). But when it is close and late the differential is negative. It is -.045 (.693 – .738)
Wednesday, July 11, 2012
Is "Pitching To Contact" Helping The Nationals?
This year the Nationals are 3rd in the NL in strikeouts per 9 IP with 8.3 and they have an ERA of 3.21. Last year they were 15th in the NL in strikeouts per 9 IP 6.5 and they had an ERA of 3.58. So it actually seems like they are striking out more batters and their ERA is lower.
This issue came up in April, 2011. See my post Can "Pitching To Contact" Lead To More Scoring? The Twins were supposedly benefiting from it. I was skeptical. Here is what I wrote:
"To look at this, I calculated the batting average and slugging percentage in the AL in 2010 on contact. For contact, I used AB - K + SF. I assumed that sacrifice hits (bunts) and their attempts rarely end up in strikeouts. So in the AL last year when a plate appearance ended in contact, the AVG was .320 and the SLG was .501.
How many runs per game might this lead to? To approximate this, I used the equation
R/G = 16.04*OBP + 11.595*SLG - 5.52
That comes from regression analysis based on the 2007-2009 seasons.
Last year the AL had a leage OBP of .327 and a league SLG of .407. The equation predicts that would lead to a runs per game of 4.44 (it was actually 4.45). But if we used .320 for OBP and used the .501 for SLG, we get 5.44 runs per game. That seems like a big difference.
I am not sure if this approximation works. It would be quite a different game with no walks and the denominator for OBP and SLG is not the same in each case. But even with that said, I am skeptical that pitching to contact (or not trying to cause batters to miss the pitch) is a good idea."
Jeff Sullivan of "Baseball Nation" has a good take on this. See Being Wrong, With The Nationals' Pitching Coach
Baseball Think Factory has an interesting discussion on this. See Nationals pitching coach Steve McCatty believes fewer K’s equals more W’s, and so far so good
Friday, July 6, 2012
Team OPS Differentials So Far In 2012

Tango uses 1.8*OBP + SLG to approximate sOBA. Here are the differntials for that

Wednesday, July 4, 2012
Career Leaders In Game Ending Homers
Jim Thome 13
Babe Ruth 12
Jimmie Foxx 12
Stan Musial 12
Mickey Mantle 12
Frank Robinson 12
Tony Perez 11
Dick Allen 10
Reggie Jackson 10
Mike Schmidt 10
Harold Baines 10
Barry Bonds 10
Sammy Sosa 10
David Ortiz 10
Albert Pujols 10
Tuesday, July 3, 2012
Can Brett Lawrie Set A New Single Season Record For Defensive WAR?
Click here to see the leaders at Baseball Reference
Update: After the July 3 game, he is up to 3.5. That is tied for the 51st best fielding season ever. If he stays on this pace, he would end up with 7.0, beating the old record by 29.6%. It looks like he had 5 assists and a putout last night. In his career he now has a defensive WAR of 5.1 in just 120 games. The single season record for a 3B man is 4.5 by Brooks Robinson in 1968. It looks like Lawrie is already in the top 10 seasons for 3B men.
"The Book" blog had an interesting discussion of Lawrie's defense in May. Part of it has to do with where he stands when the Blue Jays put on a shift, which can affect hs stats. See Has Brett Lawrie ALREADY saved 14 runs so far this year?
Sale & Strasburg vs. Non-pitchers

Strasburg has the big edge in SO% while Sale is ahead in HR% and BB%. Now let's say they each face 36 batters in a 9 inning game and we use the values from the fielding independent ERA. At 1.4 runs for a HR, Sale is just about .2 runs better. On walks, at .33 runs for a walk, he is also about .2 runs better. But using about .2 runs for strikeouts, Strasburg is about .41 better. That makes him about .1 better.
Wednesday, June 20, 2012
Do Power Hitters Choke in the Clutch?
I posted a comment on Kinkaid's post:
"Very interesting. Thanks for mentioning my research. What I posted at tango's blog I went into more detail on mine. See
Don't Let Your Little Leaguers Grow Up To Be Right-Handed Power Hitters Who Strike Out Alot Because They Might Choke In the Clutch.
I also did something several years ago called "Do Power Hitters Choke in the Clutch?" it is at Do Power Hitters Choke in the Clutch?
A study called “Clutch Hitting: Fact or Fiction?” By Andrew Dolphin suggests that they might. It is at
Clutch Hitting: Fact or Fiction
I also did something similar to what you did here by just comparing WPA to linear weights in my presentation on clutch in 2002 at the Boston SABR convention. I had Bonds doing better in the clutch than his linear weights stats would predict.
"A COMPOSITE CLUTCH HITTING STAT
A STAT THAT TAKES INTO ACCOUNT EVERY PLATE APPEARANCE, NOT JUST CERTAIN SITUATIONS. ONE EXAMPLE IS “GAME STATE VICTORIES” BY RHOIDS SPORTS ANALYSIS
"Game State Victories (GSV) is the number of wins a player contributes to his team by measuring the change in the probability of his team winning the game as a result of his At-Bat. It gives greater weight to hits made when the score is close late in the game than those made when the score difference is large or early in the game."
GSV may be similar to Bennett’s PGP (player game percentage) and the Mills brothers’ Player Win Average.
Results from linear regression
Dependent variable: GSV FOR 2001 (231 players with 300 or more at-bats)
Estimated coefficient values for independent variables (all were statistically significant)
1B = .066
2B = .079
3B = .120
HR = .122
BB = .055
Outs = -.021
R-SQUARED = .819 Intercept = -.79
The .819 means that 81.9% of the variation between hitters in GSV is explained by the 6 independent, nonclutch variables. So 81.9% of the weighted clutch performance is explained by nonclutch performance. At most, 18.1% could be explained by clutch ability.
TABLE 10

Pred = the GSVpredicted by the regression equation:
-0.79+ 0.066*1B + 0.079*2B + 0.12*3B + 0.122*HR + 0.055*BB – 0.021*Outs
Outs are At-bats – Hits. Diff = the difference between actual GSV and predicted GSV
Friday, June 15, 2012
Tom Ruane On "When Winning Streaks Collide"
Tuesday, June 12, 2012
Could Bob Gibson Have Been Better In 1970 Than In 1968?
ERA = 2.16 + 1.42*HR + .296*BB - .134*SO
Once I found the ERA predicted by this equation for each pitcher (Pred in the table below), I divided it by the league ERA in the relevant year. That number is called Ratio. The lowest ratio belongs to Gibson in 1970 with .59. Notice that he had more strikeouts per 9 IP in 1970 than in 1968. The walks were a good bit higher but HRs were pretty close. And the league ERA was much higher in 1970 (4.05 vs. 2.98).
My crude Fielding Independent ERA for Gibson in 1968 is 2.10. But for 1970 it is only a little higher at 2.40.

Tuesday, June 5, 2012
Did Bobby Abreu Have Good Numbers In The Clutch?

He has a higher AVG with RISP and runners on than with no runners on. A higher SLG with runners on than with no runners on. No his AVG in Late & Close situations is lower than overall, but that is true for baseball in general. See my article Did The Increased Use Of Relief Pitching Cause A Decline In Clutch Hitting? Usually, AVG falls by even more than what we see for Abreu (it is actually bigger than the .009 we see since my table does not show his non-Late & Close AVG). Abreu hit .295 in non-Late & Close situations. But hs .011 drop is still not quite as big as normal. And his OBP goes up. Getting on base in Late & Close situations is pretty important.
If you want to be technical, we can take IBBs out of the mix. Then his OBP falls from .395 in non-Late & Close situations (using just AB, H, BB, HBP) to .394 in Late & Close situations. Just staying at the same level is good. It usually falls. See General Clutch Data. Now that only covers 1991-2000, but I think it would be similar over Abreu's career. And just think, the other teams thought he was good enough to intentionally walk alot in Late & Close situations. 3.6% of his Late & Close PAs were IBBs. It was only 1.1% overall. So his IBB rate more than tripled in Late & Close situations. Last year in MLB, it was about 2.34 times higher.
Now someone at that site says you need to look at key games and that he did not come through often enough (no specifics are mentioned, though). But if you look at his splits, you can see his career OPS in Sept/Oct is .895, higher than his overall .877. Seems like he hit well in that month, which is most likely to have key games. Also, his career AVG in post-season games is .284, pretty good considering that you are facing better pitching than normal in cool weather. And I think those are key games.
Now the same guy is saying he batted only .243 in Sept of 2005 when they just missed the playoffs. But he still had a .388 OBP. Besides, one month is hardly enough to say he was not good in the clutch. He also batted .320 in August that year, which probably had some key games. This guy also fails to mention that when Abreu hit .294 in Sept of 2001, the Phillies only finished 2 games behind the Braves. A close race and Abreu hit well.
Monday, June 4, 2012
That 23 Year Old Phenom Pitcher Whose Last Name Starts With S Leads His League In ERA

Strasburg, using Baseball Reference splits, has struck out 27.7% of the non-pitchers he has faced this year. Sale has 26.3%. Very close.
The league average FIP's and xFIPs are not the same in each league. For Sale, his FIP and xFIP as a % of the league average are .624 and .753. Strasburg has .608 and .654. So they are very close, at least in FIP ERA.
I am not sure if Fangraphs takes park effects into account on FIP and xFIP, but the pitching park factors from Baseball Reference for Sale from 2010-2012 are 103-106-105, meaning it scores 3-5% more than average and Strasburg has 99-100-100, meaning it is just about average. So Sale's park hurts him a little more than Strasburg's.
Sale has a big lead in ERA+ which is ERA adjusted for the league averae and park effects at Baseball Reference. It could be due to Sale's lower BABIP. If he had Strasburg's .305, it looks like it would add 9 hits and that, on average, would be about 4.5 runs. That would give Sale an ERA of 2.90 and I think his ERA+ then would be about 150. Then Strasburg would have a big edge.
FIP: Fielding Independent Pitching (FIP) measures what a player’s ERA should have looked like over a given time period, assuming that performance on balls in play and timing were league average.
xFIP: Expected Fielding Independent Pitching (xFIP) is a regressed version of FIP, developed by Dave Studeman from The Hardball Times. It’s calculated in the same way as FIP, except it replaces a pitcher’s home run total with an estimate of how many home runs they should have allowed. This estimate is calculated by taking the league-average home run to fly ball rate (~9-10% depending on the year) and multiplying it by a pitcher’s fly ball rate.
Monday, May 28, 2012
White Sox Score 52 Runs In Last 5 Games, A Major League High This Year
Here the White Sox last five games:
6-0
11-8
9-3
14-7
12-6
Konerko leads MLB in AVG with .399. He also leads the AL in OBP with .476 and is 2nd to Hamilton (.753) in SLG with .681. Konerko leads Hamilton in OPS+ 211-204. Konerko's best year ever in OPS+ was 160 in 2010 and the next highest was 142 ion 2011. So this year is a big jump up for him.
Friday, May 25, 2012
Pete Palmer Has A New Book
"Basic Ball is a three-for-one deal. Fans who enjoy the three American Sports - football, baseball and basketball - will love Basic Ball. Pete Palmer, inventor of the on-base percentage stat and winner of the 2010 Ralph Hay Award from the Professional Football Research Association, has combined with Dave Heeren, creator of the TENDEX formula for basketball to give the reader the most effective statistical methods for rating players and teams in these three sports. They introduce new theories and formulas to analyze the players at the basic level. Each sport is covered in a full section and more than a hundred pages of databases that give statistical ratings for baseball's greatest hitters and pitchers; the best NFL players of All-time; and every active and retired NBA and ABA basketball player."
Palmer was doing some pretty advanced linear weights analysis back in the 60s. See Pete Palmer’s All-Time All-Star Team, 1969.
Thursday, May 24, 2012
Tim Lincecum vs. Albert Pujols

He is doing well in strikeouts and HR prevention. But his hits and walks are high and some of the bad luck might just be the high average on batting average on balls in play, which pitchers don't have as much control over. But he just happens to be pitching poorly with runners in scoring position and with with runners on. That is not true for his whole career. The next table shows this:

This year he has done well with no runners on but in other cases not so well. He has no problem like this over his career and so I think his ERA+ should rise over the season.
Pujols has a career OPS+ of 168 and last year it was 148. So the 68 so far in 2012 is pretty shocking with more than 25% of the games played. He only has a .224 BABIP while his overall AVG is .213. For his career, those numbers are .309 and .325. So it does not look like any bad luck on balls in play.
His line drive % is 20% while for his career it is 21%. So nothing major there. But hit HR/FB rate is 5.3% while it is 15.3% for his career. This year 18% of his flyballs have been in the infield while his career rate is 11%. Maybe he is popping up alot. His GB/FB rate is .70, same as it is for his whole career.
If his HR% this year was the same as it was last year (6.4%), he would have 11 HRs and his AVG would be .253 (assuming it was 7 FB outs turned into HRs). So maybe he is not hitting the ball far enough. If he wants to bat .299 this year (as he did in 2011), he needs to bat .337 the rest of the way (assuming he gets 579 ABs).
Last year his April & May OPS+'s were 112 & 113. This year they have been 61 & 70. To reach an OPS+ of 148 this year (what he had in 2011), he needs an OPS+ of 181 the rest of the way. Last year, his post May OPS+ was 172.
This year his SO/AB rate is .129, just a little higher than his career rate of .112. But his BB/AB rate is only .045 while it is .113 for his careeer (in both cases, intentional walks were taken out). So he is not walking alot and maybe he is swinging at too many pitches.
In his last 9 games or 36 ABs, he has 10 hits, good for a .278 AVG. But if he does that the rest of the way, he ends up hitting just .258. He does have 1 2B and 3 HRs in the last 9 games. So his SLG over this stretch is .556. If he did that the rest of the way he still finishes with just a .487 for all of 2012.
Wednesday, May 2, 2012
How Is That 23 Year Old Phenom Pitcher Doing? You Know, The One Whose Last Name Starts With S?

Now his being a reliever in 2010-11 helps, since relievers usually have better stats than starters. From 2007-11, relievers had, on average, an ERA that was .037 lower than starters. Sale, a lefty, also has faced left handed batters about 40% of the time. So that helps him. But he is certainly doing well this year as a starter. In 32 IP, he has an ERA of 2.81, with 24 hits allowed and 8 walks, 29 strikeouts and just 2 HRs allowed. If Strasburg had Sale's career stats or stats this year, I doubt anyone would think he was not living up to his potential.
Tuesday, May 1, 2012
Pujols Has His Worst Month Ever In OPS+, By Far
He could have had an OPS+ of 63 over 23 games in June 2006 and then 177 over the other 7 (no problem for Pujols). That would get us 90. So for Pujols to have had an OPS+ of 63 over some other 23 game stretch is possible. But it seems unlikely if you look at his next worst month, the 110 in July 2001. If he had an OPS+ of 61 in 23 games that month the other 7 would need to be 263.
And I know, I recenlty posted Should The Angels Be Worried About Pujols? (and I basically said no). But his OPS was .668 then (4-18). Now it is .570. His AVG-OBP-SLG are .217-.265-.304. The league averages are .252-.318-.408. He did recover after a slow start last year in the first two months. But at least those were above average. The table shows all months with OPS+ < 120 in red. He has struck out once every 6.57 ABs this year. Last year it was 9.98 and for his career it is 8.91.

Wednesday, April 25, 2012
How Long Can The White Sox Stay With Gordon Beckham?

Now he did actually have positive WAR last year with 1.2. But this year he has negative fielding value from Baseball Projections and Baseball Information Systems. The next table shows his OPS+ for each month of his career

Now a graph of those numbers. He is definitely trending downward.

Monday, April 23, 2012
What If Ted Williams Came Back To Life?
"In the year 2092, Ted Williams, the greatest baseball hitter of all time, is brought back to life through the science of cryonics. Once again playing for the Red Sox, Williams finds himself trapped in a world he hardly recognizes: the corruption of the game he loves with über-juiced batters and robot pitchers; difficult love affairs clashing with his old desires; and a military conflict of the future in which he must harness the fighter pilot skills he used in his first life. Dr. Elizabeth Miles is the cryonicist who brings him back to life, initiating a dramatic sequence of medical achievements. She and her young son Johnnie are a constant reminder of what Williams lacked in his first trip around the bases, never devoting much time to love and family. But old habits die hard. With enemies and allies both on the field and off, Williams must make sense of it all and play on against a machine that he detests, pressure to take the “giddyup” he abhors, unrelenting media mania, and a dystopian world he can’t ignore. The narrative resonates with the consequences of the major issues we face in our world today—the steroids debate in sports, global warming, corporate greed, technology run rampant, and the moral ambiguity of war. Extra Innings is alternately poignant and humorous, heartbreaking and joyous. Thought-provoking throughout, it’s a rollicking ride that looks at second chances and redemption, the ability to triumph over adversity, and the search for meaning in this life and the next. Flawed in his first life, Williams must decide in the second what’s more important, the chance to win his first World Series, or the chance to be a better man? The Greatest Comeback of All Time is More Than Just a Game."
Saturday, April 21, 2012
It's Easy To Be Humber When You're Perfect
Thursday, April 19, 2012
How Well Might Pujols Perform After Age 35?
In the table below they are sorted from highest to lowest in over 35 WAR. I don't have numbers for AROD or Pujols over 35 yet. So for the other 25, they averaged 13.4 WAR over age 35. As you can see, though, there is quite a distribution and Bonds must affect the average quite a bit (it is 11.67 without him).

Wednesday, April 18, 2012
Should The Angels Be Worried About Pujols?
"Eleven games into life as an Angel, Pujols has not hit a home run and the Angels have not put together so much as back-to-back wins.
That's not necessarily a problem yet, but the certain plan was to hit the twice-defending AL champion Rangers in the mouth before the nights turned warm. Instead, the Angels are rooting around for something like consistency and, this morning, sucking their breakfasts through straws."
The main Yahoo baseball had the blurb "Big-budget-flop" over a picture of Pujols looking downcast, perhaps after making an out. It also says: "In a region that runs on buzz, the Angels have been alarmingly ordinary. This isn't what owner Arte Moreno paid for" and "Brown: It's not just Pujols."
The table below shows the OPS that Pujols has had after 11 games in all of his season along with his full-season OPS. This is his 2nd worst start after 11 games. But last year was worse and he recovered to finish above .900. So he could still turn things around.

Monday, April 9, 2012
Who Was The Least Likely Triple Crown Winner?
I came up with a point system for this. A player would get 10 points for each time he led his league in HRs, 9 for a 2nd place, etc. The same was done for AVG and RBIs. So the player had a career total number of points for each stat (data from the Lee Sinins Complete Baseball Encyclopedia). A tie for 1st was still worth 10 points. Then those three numbers were multiplied times each other (meaning if a player never finished in the top 10 in one of these stats, his total will be zero). So the idea was that players that finished among the league leaders often are the ones most likely to win the triple crown.
The table below shows the point total for all the winners, from lowest to highest. I used the list from The Baseball Almanac.

Baseball Reference includes Paul Hines (1878, 36,613 points) and Tip O'Neill (1887, 50,525 points) but not Duffy. They have Sam Thompson leading the NL with 147 RBIs in 1894 and Duffy with 145. Click here to see the leaders. Hines' point total includes one year of 6th in average in the National Association, the precursor of the NL. O'Neill played most of his career in the American Association and all of his points are from that league.
So, depending on who you want to count, it is Duffy, Hines or O'Neill. Yaz is definitely the one from the live ball era (If I use the data from Baseball Reference for Duffy, his point total would be 50,456, including data from the American Association-Click here to see his page)
I did not take age into account. The oldest was Gehrig, but 31 is not that old and he is 4th all-time in this point total (see Friday's post). Cobb was just 22, but he is 5th all-time. I also did not try to figure out how far from the leader these guys were when they finished in the top 10. That could matter but I would have to come up with a way to evaluate it.
Babe Ruth was by far the most likely to win who did not. In fact, his point total is way ahead of everyone else (Ted Williams might have surpassed him without military service). How could Ruth have not won it, even once? He led the league in HRs 12 times and RBIs 6. He did win one batting title. His 81 points from AVG is the 13th highest of all-time.
In his era, not surprisingly, he ranked very high in AVG. Here are the top 4 in AVG in the AL from 1918-1931 (covering all the years he led the league in HRs) for AL players with 2500+ PAs (data from the Lee Sinins Complete Baseball Encyclopedia):
1 Al Simmons .363
2 Ty Cobb .362
3 Harry Heilmann .356
4 Babe Ruth .352
Ruth's highest average was .393 in 1923. Heilmann beat him in AVG by 10 points. Ruth lost the batting title to Heinie Manush in 1926 by just 6 points (.378-.372), a year he led in both HRs and RBIs. Ruth won the HR crown that year 47-19 over Simmons and beat George Burns 146-114 in RBIs. According to Retrosheet, Ruth was at .371 after 9-21 while Manush was at .370. It is not clear that Ruth would have known this. The NY Times does not show Ruth in the lead in the 9-22 edition. I can't find any day he was listed as the leader in Sept using Proquest.
Manush went 9 for 14 in his last 3 games after 9-21. Ruth went 5 for 12 in his last 4 games after 9-21.
In 1924, Ruth won the batting title over Charlie Jamieson, .378-.359. He led in HRs 46-27 over Joe Hauser. Goose Goslin beat him in RBIs 129-121 (the Retrosheet splits page had Goslin at 130). At the end of August, Goslin led 108-107 (but it would have been a tie if we go with the 129 figure). Ruth had only 2 RBIs in his last 13 games after 9-13. Goslin had 16 RBIs after 9-13 in his last 14 games.
Ruth was walked 12 times in his last 13 games. But that was not unusual for him. He batted 3rd the whole season (except for 1 AB). The 1st two guys in the order had OBPs of .350 and .341. Goslin batted 4th 93% of the time. The 1st 3 guys had OBPs of .357, .364 and .386. Goslin did bat 3rd the rest of the time so some of that .386 is from him. But Sam Rice batted 3rd in 318 ABs with and OBP of .399 and Bucky Harris batted 3rd in 190 ABs and had a .352 OBP. So it looks like Goslin had more RBI opportunities. It would be great to know Ruth's and Goslin's stats with runners on and in scoring position.
In 1923 Ruth led in HRs 41-29 over Ken Williams. He beat Speaker 131-130 in RBIs. As late as 9-3, Ruth led Heilman .393-.390. On the 20th, Ruth only trailed .387-.386.
Friday, April 6, 2012
Baseball's Elite, Its Millionaires
This came about while I was working on a post about who might have been the most surprising triple crown winner (I hope to post that in a day or two). I came up with a point system for this. A player would get 10 points for each time he led his league in HRs, 9 for a 2nd place, etc. The same was done for AVG and RBIs. So the player had a career total number of points for each stat (data from the Lee Sinins Complete Baseball Encyclopedia). A tie for 1st was still worth 10 points. Then those three numbers were multiplied times each other (meaning if a player never finished in the top 10 in one of these stats, his total will be zero).
There are only 4 millionaires. Ruth is the leader. He had 81 AVG points, 160 HR points (all-time leader) and 123 RBI points. Then 81*160*123 = 1,594,080. The top 25 are in the table below.

Sunday, April 1, 2012
Finally! A Completely Scientific, Objective All-Time All-Star Team
1B-Cy Barger
2B-Cy Rheam
SS-Cy Wright
3B-Cy Block
LF-Cy Neighbors
CF-Cy Seymour
RF-Cy Williams
C-Cy Perkins
SP-Cy Young
RP-Cy Acosta