Adam Darowski recently had a good article on Reuschel and his Hall of Fame worthiness. See Beyond ERA+: Why Rick Reuschel Had Hall of Fame Value. Adam uses some of the more advanced fielding stats.
Here I will just look at DER (defensive efficiency rating) and fielding pct. But first, I came up with an approximate relative ERA for Reuschel and then converted that into Wins Above Replacement (WAR).
I found all the pitchers from 1920-2011 with 2000+ IPs from the Lee Sinins Complete Baseball Encyclopedia. I also found their ERA, walks, strikeouts and HRs all relative to the league average. I ran a regression with relative ERA as the dependent variable and the others as independent variables.
Here is the equation:
ERA = 34.42 + .264*SO + .24*HR + .179*BB
Here were Reuschel's numbers
ERA 108
SO 95
HR 127
BB 138
The 108 means his ERA was 8 lower than the league average (this is without park adjustments). The 95 menas he struck out 5% fewer batters than average. His predicted relative ERA was 114, good for 64th out of the 293 pitchers. Not a super high rank, but good. He is ahead of Hall of Famers Juan Marichal and Jim Bunning, who each had around the same number of IP as Reuschel.
If I use the predicted relative ERA for each pitcher and base it on a league average of 4.00 and a replacement level of .400, Reuschel would finish 38th or in the top 13%. He is ahead of Marichal, Jim Palmer, Whitey Ford and Ted Lyons, just to name a few Hall of Famers.
Remember that I am not making any park adjustments. From 1972 –1984, the years Reuschel was on the Cubs, he was 23rd among all major league pitchers with 1000+ IP in HRs allowed relative to the league average. He allowed 25% HRs fewer than the average pitcher would have, pitching in Wrigley Field! Wrigley was a great HR park during this period, compared to other NL parks, allowing 42% more HRs than average.
Now this is all based on defense independent stats. Maybe one reason we don't see how great Reuschel is that the defense behind him was not very good. The table below shows how the Cubs ranked in DER (defensive efficiency rating) and fielding pct for the years when Reuschel pitched alot for them. DER is just what % of balls in play are turned into outs.
They were last 5 of these 9 years and Reuschel only pitched 129 innings in 1972 and well over 200 the rest of the years. They did not do too well in fielding pct, either. This next table shows the simple average for all the NL teams in these years. The Cubs were by far the worst in DER and were still below average in fielding pct.
Sunday, February 17, 2013
Wednesday, January 23, 2013
Musial and great power/contact hitters
Dave Cameron addresses this over at Fangraphs. See Translating Stan Musial’s Numbers into 2012 Norms. He compares Musial's isolated power to his strikeout frequency and then converts them into numbers for the 2012 season. He looked specifically at Musial's 1943 season and also his entire career.
A couple of things to remember. That article talks about Musial in 1943. Recall that it was a war year and alot of good pitchers were gone, so that would help him strikeout less and hit more HRs, everything else being equal. And Sportsman's park was a good hitter's park. Musial had a home ISO of .246 and a road ISO of .211 for his career. DiMaggio had .231 home and .277 away. And notice how close their SO rates were in the table below. DiMaggio had an overall career ISO of .254 while Musial had .228. And notice how close their SO rates were in the table below.
I did a study on this before and I divided a guy's relative HR rate by his relative K rate. Now that is not the same as ISO but my guess is that ISO and HR rate are highly correlated. The guy that really looks great in this analysis was DiMaggio
Musial was 70% better than the league average in ISO and DiMaggio 95% better. So, for Musial we have 1.7/.55 = 3.09. For DiMaggio we have 1.95/.59 = 3.30. DiMaggio had a better relative ISO rate divided by SO rate and he played in a bad park for righties while Musial played in a great park, especially for lefties.
Here is the link
Which Players Had The Best HR-To-Strikeout Ratios?
Musial does well but not as well as some other big names. Now here is all of that post
I looked at every player with 5000+ PAs since 1920. I found their relative HRs and their relative strikeouts. Then found the ratio of the two. Ken Williams, for example, hit 3.70 times as many HRs as the average player of his time and league while striking out only 75% as often as the average player. Since his ratio of ratios (3.7/.75 = 4.93) is the highest of anyone in the study, he is ranked first. The data comes from the Lee Sinins Complete Baseball Encyclopedia. The table below shows the top 25:

DiMaggio hit only 41% of his HRs at home in his career while Williams hit 72%. So it is likely the case that DiMaggio would rank first, and probably by a wide margin, if HRs were park adjusted. Ted Williams hit less than 50% of his HRs at home.
The next table shows which players had the lowest relative strikeout rates among guys who hit 40+ HRs. Again, no pikers here. In 2004, Bonds had only 41 strikeouts while the average player would have had 100. I am so proud to see the demonstration of Polish power with 3 for Ted Kluszewski and 1 for Carl Yastrzemski (whose 1970 season ranks 27th). Don't forget Stan Musial is 13th on the above list.

Update: I found all the guys from 1920-2011 with 5000+ PAs. I also found their ISO relative to the league average and their strikeouts relative to the league average. Then I took the ratios. Here are the top 12
Tris Speaker 4.105263158
Tommy Holmes 4.035714286
Joe Sewell 3.772727273
Frank McCormick 3.102564103
Joe DiMaggio 3.0625
Yogi Berra 3.02
Nellie Fox 2.894736842
Vic Power 2.875
Albert Pujols 2.857142857
Tony Gwynn 2.806451613
Don Mattingly 2.785714286
Stan Musial 2.741935484
The league average in the above case was based on outs or how many outs each guy made. The next one is based on PAs (these are the choices you have using the Lee Sinins data base). So the guy that really stands out is Speaker and DiMaggio still beats Musial
Tris Speaker 4.727272727
Tommy Holmes 4.185185185
Joe Sewell 3.952380952
Joe DiMaggio 3.322033898
Albert Pujols 3.214285714
Frank McCormick 3.102564103
Stan Musial 3.090909091
Yogi Berra 3.081632653
Tony Gwynn 3
Don Mattingly 2.925
Nellie Fox 2.894736842
Ted Williams 2.848101266
A couple of things to remember. That article talks about Musial in 1943. Recall that it was a war year and alot of good pitchers were gone, so that would help him strikeout less and hit more HRs, everything else being equal. And Sportsman's park was a good hitter's park. Musial had a home ISO of .246 and a road ISO of .211 for his career. DiMaggio had .231 home and .277 away. And notice how close their SO rates were in the table below. DiMaggio had an overall career ISO of .254 while Musial had .228. And notice how close their SO rates were in the table below.
I did a study on this before and I divided a guy's relative HR rate by his relative K rate. Now that is not the same as ISO but my guess is that ISO and HR rate are highly correlated. The guy that really looks great in this analysis was DiMaggio
Musial was 70% better than the league average in ISO and DiMaggio 95% better. So, for Musial we have 1.7/.55 = 3.09. For DiMaggio we have 1.95/.59 = 3.30. DiMaggio had a better relative ISO rate divided by SO rate and he played in a bad park for righties while Musial played in a great park, especially for lefties.
Here is the link
Which Players Had The Best HR-To-Strikeout Ratios?
Musial does well but not as well as some other big names. Now here is all of that post
I looked at every player with 5000+ PAs since 1920. I found their relative HRs and their relative strikeouts. Then found the ratio of the two. Ken Williams, for example, hit 3.70 times as many HRs as the average player of his time and league while striking out only 75% as often as the average player. Since his ratio of ratios (3.7/.75 = 4.93) is the highest of anyone in the study, he is ranked first. The data comes from the Lee Sinins Complete Baseball Encyclopedia. The table below shows the top 25:

DiMaggio hit only 41% of his HRs at home in his career while Williams hit 72%. So it is likely the case that DiMaggio would rank first, and probably by a wide margin, if HRs were park adjusted. Ted Williams hit less than 50% of his HRs at home.
The next table shows which players had the lowest relative strikeout rates among guys who hit 40+ HRs. Again, no pikers here. In 2004, Bonds had only 41 strikeouts while the average player would have had 100. I am so proud to see the demonstration of Polish power with 3 for Ted Kluszewski and 1 for Carl Yastrzemski (whose 1970 season ranks 27th). Don't forget Stan Musial is 13th on the above list.

Update: I found all the guys from 1920-2011 with 5000+ PAs. I also found their ISO relative to the league average and their strikeouts relative to the league average. Then I took the ratios. Here are the top 12
Tris Speaker 4.105263158
Tommy Holmes 4.035714286
Joe Sewell 3.772727273
Frank McCormick 3.102564103
Joe DiMaggio 3.0625
Yogi Berra 3.02
Nellie Fox 2.894736842
Vic Power 2.875
Albert Pujols 2.857142857
Tony Gwynn 2.806451613
Don Mattingly 2.785714286
Stan Musial 2.741935484
The league average in the above case was based on outs or how many outs each guy made. The next one is based on PAs (these are the choices you have using the Lee Sinins data base). So the guy that really stands out is Speaker and DiMaggio still beats Musial
Tris Speaker 4.727272727
Tommy Holmes 4.185185185
Joe Sewell 3.952380952
Joe DiMaggio 3.322033898
Albert Pujols 3.214285714
Frank McCormick 3.102564103
Stan Musial 3.090909091
Yogi Berra 3.081632653
Tony Gwynn 3
Don Mattingly 2.925
Nellie Fox 2.894736842
Ted Williams 2.848101266
Friday, January 11, 2013
Bagwell Is A Clear Hall Of Famer Unless He Used PEDs
He is 36th in career WAR among position players. He twice led the league and 2 other times was 5th. By my count there are 147 position players in the Hall who played in the majors (I am not counting Negro league players only because we don't have a WAR ranking for them).
This puts Bagwell in the to 25% of career value among the top 147. Maybe he will get in eventually, but his gain this year was slight.
Bagwell had 387 career Win Shares. Through 2001, that would have been tied for 56th among all players, including pitchers. Not sure where he would rank now, definitely still in the top 100.
I count 63 pitchers, so there are 210 players + pitchers. Bagwell clearly is above the bar by two different measures, WAR and Win Shares. I doubt both of these measures are so seriously flawed that he should not be in.
Is there some reason to keep waiting to see if proof of using PEDs is found? I don't think so.
This puts Bagwell in the to 25% of career value among the top 147. Maybe he will get in eventually, but his gain this year was slight.
Bagwell had 387 career Win Shares. Through 2001, that would have been tied for 56th among all players, including pitchers. Not sure where he would rank now, definitely still in the top 100.
I count 63 pitchers, so there are 210 players + pitchers. Bagwell clearly is above the bar by two different measures, WAR and Win Shares. I doubt both of these measures are so seriously flawed that he should not be in.
Is there some reason to keep waiting to see if proof of using PEDs is found? I don't think so.
Thursday, January 10, 2013
Was Biggio Treated Differently Than Other Members Of The 3000 Hit Club?
It looks like 12 of the last 13 guys with 3000+ hits got elected in their
first year of eligibility. The one who did not is Palmeiro. The streak might
even be longer since I am starting with Brock in 85. Two of these guys had
less career WAR than Biggio (62.1). Winfield (59.4) and Brock (42.8). Murray (63.4) and Gwynn
(65.3) were just slightly higher.
Wednesday, January 9, 2013
How Does Piazza's Vote Percentage Compare To Other Great Catchers?
The table below shows the top 10 in career WAR for guys who played 50%+ games at catcher
Carter actually fell to about 33% in his 2nd year and slowly rose to make it. So Piazza did better than Carter but not as well as Berra. Carter jumped to about 49 in his 3rd year and to 64 in his 4th year. He had 72.7 in year 5. We could look at Piazza's vote as pretty normal for a catcher. We don't have to say that he was necessarily affected by the steroids era.
Ted Simmons caught more games than Johnny Bench, Ray Schalk, Bill Dickey and Yogi Berra. More innings than Bench.
The votes for Dickey, Hartnett and Cochrane are a little strange as the rules were in flux. Their vote histories from Baseball Reference are below. What I use for 1st year above is 6 years after their last year, which would be in line with today's rules, although Cochrane got no votes in that year (1943). As you can see below, he did get votes in 1942, so I used that above.
Hartnett jumped 20 points in 1953, from about 39 to 59 and got in the next year
Hall of Fame-Dickey
1945 BBWAA ( 6.9%)
1946 Final Ballot (12.2%)
1946 Nominating Vote (19.8%)
1948 BBWAA (32.2%)
1949 BBWAA (42.5%)
1949 Run Off (20.9%)
1950 BBWAA (46.4%)
1951 BBWAA (52.2%)
1952 BBWAA (59.4%)
1953 BBWAA (67.8%)
1954 BBWAA (80.2%)
Selected to HOF in 1954 by BBWAA
Hall of Fame-Hartnett
1936 BBWAA ()
1945 BBWAA ( 0.8%)
1946 Nominating Vote ( 1.0%)
1947 BBWAA ( 1.2%)
1948 BBWAA (27.3%)
1949 BBWAA (22.9%)
1949 Run Off ( 3.7%)
1950 BBWAA (32.1%)
1951 BBWAA (25.2%)
1952 BBWAA (32.9%)
1953 BBWAA (39.4%)
1954 BBWAA (59.9%)
1955 BBWAA (77.7%)
Selected to HOF in 1955 by BBWAA
Hall of Fame-Cochrane
1936 BBWAA (35.4%)
1939 BBWAA (10.2%)
1942 BBWAA (37.8%)
1945 BBWAA (50.6%)
1946 Final Ballot (24.7%)
1946 Nominating Vote (39.6%)
1947 BBWAA (79.5%)
Selected to HOF in 1947 by BBWAA
Carter actually fell to about 33% in his 2nd year and slowly rose to make it. So Piazza did better than Carter but not as well as Berra. Carter jumped to about 49 in his 3rd year and to 64 in his 4th year. He had 72.7 in year 5. We could look at Piazza's vote as pretty normal for a catcher. We don't have to say that he was necessarily affected by the steroids era.
Ted Simmons caught more games than Johnny Bench, Ray Schalk, Bill Dickey and Yogi Berra. More innings than Bench.
The votes for Dickey, Hartnett and Cochrane are a little strange as the rules were in flux. Their vote histories from Baseball Reference are below. What I use for 1st year above is 6 years after their last year, which would be in line with today's rules, although Cochrane got no votes in that year (1943). As you can see below, he did get votes in 1942, so I used that above.
Hartnett jumped 20 points in 1953, from about 39 to 59 and got in the next year
Hall of Fame-Dickey
1945 BBWAA ( 6.9%)
1946 Final Ballot (12.2%)
1946 Nominating Vote (19.8%)
1948 BBWAA (32.2%)
1949 BBWAA (42.5%)
1949 Run Off (20.9%)
1950 BBWAA (46.4%)
1951 BBWAA (52.2%)
1952 BBWAA (59.4%)
1953 BBWAA (67.8%)
1954 BBWAA (80.2%)
Selected to HOF in 1954 by BBWAA
Hall of Fame-Hartnett
1936 BBWAA ()
1945 BBWAA ( 0.8%)
1946 Nominating Vote ( 1.0%)
1947 BBWAA ( 1.2%)
1948 BBWAA (27.3%)
1949 BBWAA (22.9%)
1949 Run Off ( 3.7%)
1950 BBWAA (32.1%)
1951 BBWAA (25.2%)
1952 BBWAA (32.9%)
1953 BBWAA (39.4%)
1954 BBWAA (59.9%)
1955 BBWAA (77.7%)
Selected to HOF in 1955 by BBWAA
Hall of Fame-Cochrane
1936 BBWAA (35.4%)
1939 BBWAA (10.2%)
1942 BBWAA (37.8%)
1945 BBWAA (50.6%)
1946 Final Ballot (24.7%)
1946 Nominating Vote (39.6%)
1947 BBWAA (79.5%)
Selected to HOF in 1947 by BBWAA
Monday, January 7, 2013
Did Good Hitters Behind Jim Rice Prevent Him From Being Intentionally Walked?
Probably not. This is a follow up on a post I did a few years ago. See Was Jim Rice A Feared Hitter?
Someone on Twitter suggested that he had good hitters behind him that kept him from being intentionally walked. But it seems like his IBBs were pretty low for a slugger like him.
One thing I should check is if Rice came up with a man on 1st more than average. That would tend to lower IBBs.
But here is a brief analysis. It looks like Rice's best years were 77-79 and 83. The numbers below show the AVG-OBP-SLG of how the slot behind him did on the Red Sox for those years. Then I show it for the league average in those years. I don't think the differences are that great.
Red Sox
1977(5th) .274-.345-.486
1978(4th) .271-.358-.417
1979(5th) .283-.346-.474
1983(4th) .224-.260-.440
Look at how weak the hitters did behind Rice in 1983 and yet he had only 10 IBBs (tied for 9th). Singleton led with 19.
League Average for those slots, same years
1977(5th) .272-.337-.450
1978(4th) .271-.342-.440
1979(5th) .280-.349-.454
1983(4th) .280-.347-.460
Again, it does not look like Rice was followed by unusually good hitters compared to the league average.
In 1978, Ben Ogilvie had 10 IBBs and Rice had 7. Remmber, this was Rice's best year, with 46 HRs. The guys batting 6th on Milwaukee that year had AVG-OBP-SLG of .301-.359 -.448, far better than the guys behind Rice. Ogilvie batted mostly 5th that year and had 18 HRs and a .303 AVG. Rice hit 46 HRs with a .315 AVG. Rice had more impressive stats and weaker hitters behind him yet he had fewer IBBs. Carew actually led the league with 19.
Here are the numbers on the percentage of time Rice came up with a man on 1st (but not 1st only), then followed by the league averages.
1977 31.1%
1978 30%
1979 36.3%
1983 40.8%
League average
1977 30.5%
1978 30.7%
1979 31%
1983 30.7%
So in two of these years, Rice was at the league average. That would not stop him from getting walked intentionally. The other years he did have a man blocking an IBB on 1st more than average. But again, in 1978 he had his best year, the guys behind him did not hit very well and he only had an average number of guys on 1st. Yet he had only 7 IBBs.
Take Don Baylor in 1978. He had 9 IBBs with 34 HRs and a .255 AVG. Less fearsome than Rice's numbers. He batted mostly 5th, but a good chunk came 4th, too. The 6th place hitters on the Angels had a .423 SLG, only .049 below Baylor's .472. So if you walk him, you don't gain much. Rice had an SLG of .600, so walking him saved you .183. Big incentive to give him a walk.
Now Baylor did bat 4th a good bit, too. So how did the 5th place hitters do? Some of that includes him. But if you take that out, they slugged .453. almost as good as Baylor. So again, IBBing him is no big gain.
28.5% of the time was there a man on 1st with Baylor up. That is less than Rice (30%) but not that much. With 1st base open, you will IBB a guy more. But gain the difference is not that great and with Rice you had a huge gain in SLG.
In 1979, Wayne Gross of the A's had 9 IBBs. He batted .224 with 14 HRs in 138 games. Jim Rice who batted .325 and had 39 HRs had 4 IBBs (and surely he had a fearsome reputation after winning the MVP award the year before). Gross tended to bat 3rd or 5th. The 4th place hitters on Oakland had a SLG of .406. 6th place hitters slugged .332. Gross slugged .367. It was hardly any advantage for A's opponents to walk him. Yet he more than double Rice's total.
Someone on Twitter suggested that he had good hitters behind him that kept him from being intentionally walked. But it seems like his IBBs were pretty low for a slugger like him.
One thing I should check is if Rice came up with a man on 1st more than average. That would tend to lower IBBs.
But here is a brief analysis. It looks like Rice's best years were 77-79 and 83. The numbers below show the AVG-OBP-SLG of how the slot behind him did on the Red Sox for those years. Then I show it for the league average in those years. I don't think the differences are that great.
Red Sox
1977(5th) .274-.345-.486
1978(4th) .271-.358-.417
1979(5th) .283-.346-.474
1983(4th) .224-.260-.440
Look at how weak the hitters did behind Rice in 1983 and yet he had only 10 IBBs (tied for 9th). Singleton led with 19.
League Average for those slots, same years
1977(5th) .272-.337-.450
1978(4th) .271-.342-.440
1979(5th) .280-.349-.454
1983(4th) .280-.347-.460
Again, it does not look like Rice was followed by unusually good hitters compared to the league average.
In 1978, Ben Ogilvie had 10 IBBs and Rice had 7. Remmber, this was Rice's best year, with 46 HRs. The guys batting 6th on Milwaukee that year had AVG-OBP-SLG of .301-.359 -.448, far better than the guys behind Rice. Ogilvie batted mostly 5th that year and had 18 HRs and a .303 AVG. Rice hit 46 HRs with a .315 AVG. Rice had more impressive stats and weaker hitters behind him yet he had fewer IBBs. Carew actually led the league with 19.
Here are the numbers on the percentage of time Rice came up with a man on 1st (but not 1st only), then followed by the league averages.
1977 31.1%
1978 30%
1979 36.3%
1983 40.8%
League average
1977 30.5%
1978 30.7%
1979 31%
1983 30.7%
So in two of these years, Rice was at the league average. That would not stop him from getting walked intentionally. The other years he did have a man blocking an IBB on 1st more than average. But again, in 1978 he had his best year, the guys behind him did not hit very well and he only had an average number of guys on 1st. Yet he had only 7 IBBs.
Take Don Baylor in 1978. He had 9 IBBs with 34 HRs and a .255 AVG. Less fearsome than Rice's numbers. He batted mostly 5th, but a good chunk came 4th, too. The 6th place hitters on the Angels had a .423 SLG, only .049 below Baylor's .472. So if you walk him, you don't gain much. Rice had an SLG of .600, so walking him saved you .183. Big incentive to give him a walk.
Now Baylor did bat 4th a good bit, too. So how did the 5th place hitters do? Some of that includes him. But if you take that out, they slugged .453. almost as good as Baylor. So again, IBBing him is no big gain.
28.5% of the time was there a man on 1st with Baylor up. That is less than Rice (30%) but not that much. With 1st base open, you will IBB a guy more. But gain the difference is not that great and with Rice you had a huge gain in SLG.
In 1979, Wayne Gross of the A's had 9 IBBs. He batted .224 with 14 HRs in 138 games. Jim Rice who batted .325 and had 39 HRs had 4 IBBs (and surely he had a fearsome reputation after winning the MVP award the year before). Gross tended to bat 3rd or 5th. The 4th place hitters on Oakland had a SLG of .406. 6th place hitters slugged .332. Gross slugged .367. It was hardly any advantage for A's opponents to walk him. Yet he more than double Rice's total.
Larry Walker's All-Around Ability And His Hall Of Fame Worthiness
Last year I tried to quantify who the greatest "all-around" players were. I tried to take into account hitting for power, hitting for average, speed and defense (I so far have not broken down defense into catching and throwing).
I used various formulas and tried to have everything adjusted for the league average and park effects (where possible). Besides a simple score of "all-aroundness," I also tried to calculate one that was "above replacement." That allows longevity to play a role. Below are the three posts I did on this. The last one is the best attempt, I think.
In Part 3, Walker had the 87th best "all-around" score out of 913 players with 5000+ PAs through 2011. Above replacement, he is 96th. So he is around being in the top 10%. He did have alot of assists, so if I could break down defense into catching and throwing, he might do a bit better.
If you think being an "all-around player" matters, perhaps this would make you want to vote for Walker more. That might be a reasonable argument. Maybe the "all-around" players are more likely to excel no matter what the circumstances or playing conditions.
So here are the links
Who Was The Greatest "All-Around" Player Ever? Another Quantitative Attempt
Who Was The Greatest "All-Around" Player Ever? Another Quantitative Attempt (Part 2)
Who Was The Greatest "All-Around" Player Ever? Another Quantitative Attempt (Part 3)
I used various formulas and tried to have everything adjusted for the league average and park effects (where possible). Besides a simple score of "all-aroundness," I also tried to calculate one that was "above replacement." That allows longevity to play a role. Below are the three posts I did on this. The last one is the best attempt, I think.
In Part 3, Walker had the 87th best "all-around" score out of 913 players with 5000+ PAs through 2011. Above replacement, he is 96th. So he is around being in the top 10%. He did have alot of assists, so if I could break down defense into catching and throwing, he might do a bit better.
If you think being an "all-around player" matters, perhaps this would make you want to vote for Walker more. That might be a reasonable argument. Maybe the "all-around" players are more likely to excel no matter what the circumstances or playing conditions.
So here are the links
Who Was The Greatest "All-Around" Player Ever? Another Quantitative Attempt
Who Was The Greatest "All-Around" Player Ever? Another Quantitative Attempt (Part 2)
Who Was The Greatest "All-Around" Player Ever? Another Quantitative Attempt (Part 3)
Saturday, January 5, 2013
Who was the youngest pitcher to ever win a game in major league baseball since 1900? Rogers Hornsby. Rogers Hornsby McKee, that is.
He was born in 1926 and named after the great 2B man. He pitched a few games during WWII and played in the minors for several years after that, although not as a pitcher since he hurt his arm. He is still alive. He hit 33 HRs one year and batted .357 for Baton Rouge in 1953. Here are links to some articles about him:
A career in a moment by Scott Fowler of the The Charlotte Observer. On thing it says is that in 2009 the Phillies "paid for McKee and his entire family to come to Philadelphia for alumni night and honored him on their field."
eBay Item of the Day: Named for Greatness by Jim Baker, featuring a picture autographed by McKee. Jim has lots of info about the game he won.
A short biography at Baseball Reference
Where Are They Now: Rogers McKee by Larry Shenk, writing for the Phillies link at MLB.com.
A baseball star -- for one day from Scott Fowler's blog.
A career in a moment by Scott Fowler of the The Charlotte Observer. On thing it says is that in 2009 the Phillies "paid for McKee and his entire family to come to Philadelphia for alumni night and honored him on their field."
eBay Item of the Day: Named for Greatness by Jim Baker, featuring a picture autographed by McKee. Jim has lots of info about the game he won.
A short biography at Baseball Reference
Where Are They Now: Rogers McKee by Larry Shenk, writing for the Phillies link at MLB.com.
A baseball star -- for one day from Scott Fowler's blog.
Wednesday, January 2, 2013
Monday, December 31, 2012
Why Did The Yankees Finish 13.5 Games Behind The A's In 1931?
The A's were 107-45 for a .704 pct while the Yankees were 94-59 for a .614 pct. The A's outscored their opponents 858-626 (good for a 97-55 Pythagorean W-L record) while the Yankees outscored their opponents 1067-760 (good for a 100-53 Pythagorean W-L record). All data comes from Retrosheet and Baseball Reference.
The A's were 19-14 in 1run games while the Yankees were 19-20. The Yankees were 44-9 in games decided by 5+ runs, a .830 pct. The A's were 31-14 in games decided by 5+ runs, a .689 pct. So it looks like the A's were not especially great in close games or in lopsided games, while the Yanks did poorly in close games and great in lopsided games.
The A's and Yankees were also about even in their differentials in AVG, OBP and SLG. The following table shows this.
The A's had a batting average differential that was just .001 better. They were slightly better in SLG differential but that is offset by the Yankees having a better OBP differential. It seems like they should have had very similar records.
Maybe it was something else. Maybe the A's had better baserunning or reached on errors (ROE) alot more than their opponents. No, that is not the case, either, as the next table shows (the little i means Retrosheet does not have complete data on something).
Neither team had an especially big advantage in ROE or GDP, based on what is available. But the Yankees seemed to do alot better in stealing. The SB and CS for their opponents is about the same for both the Yankees and A's. But the Yankees stole alot more bases with a much better pct. So there is still no statistical smoking gun.
But the A's came through in the clutch alot more as the next couple of tables will show. RISP means withe runners in scoring position (Retrosheet notes that they don't have complete numbers on these splits).
It may be hard to take all that in, so the next table shows the differential for each team. But notice how well the A's hit with men on, with RISP and when it was Close & Late. Just incredible. The Yankees did not hit especially well when it was Close & Late.
The advantages the A's have when it was Close & Late are just astounding. They outslugged their opponents by .175. The Yankees, meanwhile, seemed, at best, to break even with their opponents when it was Close & Late. Maybe this is the key to the 13.5 game margin.
The Yankees and A's split their 22 games at 11 wins each. But the Yanks outscored them 124-97, which should have given them 13.6 wins or a .620 pct.
The A's won 7 games by 1 or 2 runs while the Yanks won 4. The Yanks won 3 games by margins of 11, 12 and 12 runs while the A's won only one game by 10 + runs (12).
At the end of August, the Yankees were 17.5 games behind (actually in 3rd place-the Senators were in 2nd, 15.5 games out). They had a Pythagorean W-L pct. of 0.625. The A's had about .670. The Yankees would have been about 5 games out, still with a chance to win the pennant. But they only had 3 more games left against the A's.
The Yankees actually went 21-6 after Aug. 31, outscoring their opponents 198-87. The A's were just 17-10, outscoring their opponents 137-120. They really had no need to try very hard that last month. So some of the mystery is solved with the September performance. But still, going into that month, the Yankees should not have been that far behind. The A's performance in the clutch is what gave them the big edge. This is probably due to luck.
Update Jan. 2: Although the A's had a better Pythagorean W-L pct. through August, it is still possible that the Yankees "out played" them. I don't have the OPS differential for each team through August, but I can show something similar based on each team's HRs, nonHRs and BBs and what they allowed in those stats.
I have previsously run regressions with the differentials of those stats on a per game basis to explain a team's winning pct. Here are the differentials each team had per game through August:
A's: 0.341, 1.22, 0.444
Yanks: 0.496, 0.512, 1.094
Here is the regression equation for the 1930s that I came up with
Pct = 0.496 + 0.145*HR + 0.035*NONHR + 0.025*BB
Now those are all differentials. If you plug in the values for the A's, you get .599. So they were a very good team through Aug. But the Yankees were better, at .613. So even before Sept, when the A's were able to coast, they still must have been timing things better than the Yankees, being 17.5 games ahead of them.
Again, I wish I had the OPS differential for the pre-Sept games. One problem with this lastest analysis is that it does not take into account what the nonHR hits were. It turns out the A's hit more 1Bs, 2Bs and 3Bs than their opponents while the Yankees just had more 1Bs. The Yankees actually had fewer 2Bs and fewer 3Bs.
So I assumed that the breakdown each team had for 1Bs, 2Bs and 3Bs as a percentage of all nonHRs was the same pre-Sept as it was for the whole season (this was done for those hits allowed, too).
Then I found each team's differential for 1Bs, 2Bs and 3Bs as well as HRs and BBs, but for pre-Sept. only. Then I calculated the linear weights value of those differentials. I had the A's being 177 runs better than their opponents while the Yankees were about 150 runs better.
So that makes the A's a better team pre-Sept. But those 27 runs are worth only about 2.7 wins. It should have been a close pennant race up to that time. So, again, it was pretty lucky for the A's that they had such great timing in getting or preventing hits.
The A's were 19-14 in 1run games while the Yankees were 19-20. The Yankees were 44-9 in games decided by 5+ runs, a .830 pct. The A's were 31-14 in games decided by 5+ runs, a .689 pct. So it looks like the A's were not especially great in close games or in lopsided games, while the Yanks did poorly in close games and great in lopsided games.
The A's and Yankees were also about even in their differentials in AVG, OBP and SLG. The following table shows this.
The A's had a batting average differential that was just .001 better. They were slightly better in SLG differential but that is offset by the Yankees having a better OBP differential. It seems like they should have had very similar records.
Maybe it was something else. Maybe the A's had better baserunning or reached on errors (ROE) alot more than their opponents. No, that is not the case, either, as the next table shows (the little i means Retrosheet does not have complete data on something).
Neither team had an especially big advantage in ROE or GDP, based on what is available. But the Yankees seemed to do alot better in stealing. The SB and CS for their opponents is about the same for both the Yankees and A's. But the Yankees stole alot more bases with a much better pct. So there is still no statistical smoking gun.
But the A's came through in the clutch alot more as the next couple of tables will show. RISP means withe runners in scoring position (Retrosheet notes that they don't have complete numbers on these splits).
It may be hard to take all that in, so the next table shows the differential for each team. But notice how well the A's hit with men on, with RISP and when it was Close & Late. Just incredible. The Yankees did not hit especially well when it was Close & Late.
The advantages the A's have when it was Close & Late are just astounding. They outslugged their opponents by .175. The Yankees, meanwhile, seemed, at best, to break even with their opponents when it was Close & Late. Maybe this is the key to the 13.5 game margin.
The Yankees and A's split their 22 games at 11 wins each. But the Yanks outscored them 124-97, which should have given them 13.6 wins or a .620 pct.
The A's won 7 games by 1 or 2 runs while the Yanks won 4. The Yanks won 3 games by margins of 11, 12 and 12 runs while the A's won only one game by 10 + runs (12).
At the end of August, the Yankees were 17.5 games behind (actually in 3rd place-the Senators were in 2nd, 15.5 games out). They had a Pythagorean W-L pct. of 0.625. The A's had about .670. The Yankees would have been about 5 games out, still with a chance to win the pennant. But they only had 3 more games left against the A's.
The Yankees actually went 21-6 after Aug. 31, outscoring their opponents 198-87. The A's were just 17-10, outscoring their opponents 137-120. They really had no need to try very hard that last month. So some of the mystery is solved with the September performance. But still, going into that month, the Yankees should not have been that far behind. The A's performance in the clutch is what gave them the big edge. This is probably due to luck.
Update Jan. 2: Although the A's had a better Pythagorean W-L pct. through August, it is still possible that the Yankees "out played" them. I don't have the OPS differential for each team through August, but I can show something similar based on each team's HRs, nonHRs and BBs and what they allowed in those stats.
I have previsously run regressions with the differentials of those stats on a per game basis to explain a team's winning pct. Here are the differentials each team had per game through August:
A's: 0.341, 1.22, 0.444
Yanks: 0.496, 0.512, 1.094
Here is the regression equation for the 1930s that I came up with
Pct = 0.496 + 0.145*HR + 0.035*NONHR + 0.025*BB
Now those are all differentials. If you plug in the values for the A's, you get .599. So they were a very good team through Aug. But the Yankees were better, at .613. So even before Sept, when the A's were able to coast, they still must have been timing things better than the Yankees, being 17.5 games ahead of them.
Again, I wish I had the OPS differential for the pre-Sept games. One problem with this lastest analysis is that it does not take into account what the nonHR hits were. It turns out the A's hit more 1Bs, 2Bs and 3Bs than their opponents while the Yankees just had more 1Bs. The Yankees actually had fewer 2Bs and fewer 3Bs.
So I assumed that the breakdown each team had for 1Bs, 2Bs and 3Bs as a percentage of all nonHRs was the same pre-Sept as it was for the whole season (this was done for those hits allowed, too).
Then I found each team's differential for 1Bs, 2Bs and 3Bs as well as HRs and BBs, but for pre-Sept. only. Then I calculated the linear weights value of those differentials. I had the A's being 177 runs better than their opponents while the Yankees were about 150 runs better.
So that makes the A's a better team pre-Sept. But those 27 runs are worth only about 2.7 wins. It should have been a close pennant race up to that time. So, again, it was pretty lucky for the A's that they had such great timing in getting or preventing hits.
Thursday, December 20, 2012
1974: The Year The MVP Voting Went To Heck
This is a family blog, so I have to say heck.
After checking data at Baseball Reference, 1974 looks like the first year that none of the top 3 vote getters in either league were among the top 10 in WAR. I did not find this happening in any year before, even if in only one league (if I missed one, let me know). At least one of the top 3 vote getters was in the top 10 of position players or pitchers in all previous years.
Here are the top 3 in each league from that year:
NL
Garvey
Brock
Mike Marshall (not in the top 10 for pitchers)
AL
Burroughs
Rudi
Bando
Now this is not a systematic analysis. Maybe other years were worse in terms of how well WAR was correlated with the points each guy got.
There were 3 times I found where the winner was not in the top 10 in WAR, but at least one of the other top 3 guys was
Frisch 1931
Cochrane 1934
Powell 1970 (Oliva was 2nd in voting and was in the top 10 in WAR but Killebrew (3rd) was not)
There were some cases of a winner tying for 10th (Boyer, Campanella). Konstanty was 7th among pitchers in 1950, but not in the overall top 10 (which combined pitchers and position players).
Now Frisch and Cochane were also managers. Maybe that influenced the voters.
In 1974, Reggie Jackson, Gene Tenace and Bert Campaneris all had more WAR than teammates Rudi & Bando.
In the NL, Garvey led his team in RBIs and batted over .300. His teammate, Jimmy Wynn, beat him in WAR, 7.6 to 4.3. But Garvey beat him in AVG (.312-.271) and RBIs (111-108).
Brock set the then SB record with 118. Maury Wills won the award in 1962 when he set a record with 104, so I guess the voters thought Brock had to get some consideration. But Garvey's Dodgers won their division while Brock's Cardinals did not.
Mike Marshall set a record for games pitched with 106 and won the Cy Young award while pitching for the Dodgers.
Jeff Burroughs led the AL in RBIs with 118 (while also batting .301). But his Rangers did not win their division. Only one other player, Bando, had 100+ RBIs in the AL (he had 103).
Here is something I found about that year's MVP vote from the following site
http://www.mrpopculture.com/files/November%208,%201974.pdf
Click here to see the MVP voting for both leagues in 1974
Click here to see the WAR leaders among position players in the NL in 1974
Click here to see the WAR leaders among position pitchers in the NL in 1974
Click here to see the WAR leaders among position players in the AL in 1974
Click here to see the WAR leaders among position pitchers in the AL in 1974
After checking data at Baseball Reference, 1974 looks like the first year that none of the top 3 vote getters in either league were among the top 10 in WAR. I did not find this happening in any year before, even if in only one league (if I missed one, let me know). At least one of the top 3 vote getters was in the top 10 of position players or pitchers in all previous years.
Here are the top 3 in each league from that year:
NL
Garvey
Brock
Mike Marshall (not in the top 10 for pitchers)
AL
Burroughs
Rudi
Bando
Now this is not a systematic analysis. Maybe other years were worse in terms of how well WAR was correlated with the points each guy got.
There were 3 times I found where the winner was not in the top 10 in WAR, but at least one of the other top 3 guys was
Frisch 1931
Cochrane 1934
Powell 1970 (Oliva was 2nd in voting and was in the top 10 in WAR but Killebrew (3rd) was not)
There were some cases of a winner tying for 10th (Boyer, Campanella). Konstanty was 7th among pitchers in 1950, but not in the overall top 10 (which combined pitchers and position players).
Now Frisch and Cochane were also managers. Maybe that influenced the voters.
In 1974, Reggie Jackson, Gene Tenace and Bert Campaneris all had more WAR than teammates Rudi & Bando.
In the NL, Garvey led his team in RBIs and batted over .300. His teammate, Jimmy Wynn, beat him in WAR, 7.6 to 4.3. But Garvey beat him in AVG (.312-.271) and RBIs (111-108).
Brock set the then SB record with 118. Maury Wills won the award in 1962 when he set a record with 104, so I guess the voters thought Brock had to get some consideration. But Garvey's Dodgers won their division while Brock's Cardinals did not.
Mike Marshall set a record for games pitched with 106 and won the Cy Young award while pitching for the Dodgers.
Jeff Burroughs led the AL in RBIs with 118 (while also batting .301). But his Rangers did not win their division. Only one other player, Bando, had 100+ RBIs in the AL (he had 103).
Here is something I found about that year's MVP vote from the following site
http://www.mrpopculture.com/files/November%208,%201974.pdf
"Lou Brock, who finished second to Steve Garvey in the National League MVP voting, says he wouldn't accept the MVP next year if he stole a thousand bases. Brock, who had his best year ever, expected to get the award and even set-up a press conference. Brock beat Maury Wills' 12-year old record of 104 steals."I found a NY Times article through my school's library that confirms the 1000 base quote and this is how I recall it. Brock also said the voters used "bad judgement" and his manager, Schoendienst, agreed.
Click here to see the MVP voting for both leagues in 1974
Click here to see the WAR leaders among position players in the NL in 1974
Click here to see the WAR leaders among position pitchers in the NL in 1974
Click here to see the WAR leaders among position players in the AL in 1974
Click here to see the WAR leaders among position pitchers in the AL in 1974
Sunday, November 11, 2012
Verlander For The Cy Young Award?
I don't think you have use too many advanced stats or new formulas to make a case. Steve Kornacki comes up with a new metric to support Verlander. See Making case for Verlander. (Hat Tip: Baseball Think Factory) But I don't think that is really necessary.
Verlander led the league in IP and strikeouts and was 2nd in ERA to Price (2.56 vs. 2.64). Verlander had 238 IP while Price had 211.
He was 2nd to Weaver in WHIP (1.018 vs. 1.057).
He was 2nd to Weaver in hits per 9 IP (7.012 vs. 7.25). Price was 4th, Sabathia was not in the top 10.
He was 2nd to Sabathia strikeout-to-walk ratio (4.477 vs. 3.983). Price is not in the top 10. Weaver is not in the top 10.
He was 5th in HRs per 9 IP. Price is 4th. Sabathia is not in the top 10. Weaver is not in the top 10.
He was 3rd in strikeouts per 9 IP. Sabathia was 6th and Price was Price was 8th. Weaver is not in the top 10.
A reasonable objection to Verlander is that he might have been helped by his fielders. But look at how well he did in HR per 9 IP, strikeouts per 9 IP, and strikeout-to-walk ratio. So he did very well in "fielding independent" stats.
Now Verlander did not make the top 10 in walks per 9 IP (he had 2.3). Sabathia (4th, 1.98) and Weaver (7th, 2.147) did. But he beats both of them by a wide margin in IP. Weaver had 188 and Sabathia had 200.
His park could have helped him. But here is where one of the simpler sabermetric stats comes in handy. ERA+, which takes into account park effects and the league average. Verlaner led the league with 160 (meaning he was 60% better than the league average). Price was 2nd with 149. So a very solid lead for Verlander. Weaver had 134 and Sabathia had 124.
His teammate Scherzer led the league in strikeouts per 9 IP. But Scherzer did not make the top 10 in IP, HR per 9 IP, or ERA+ and was just 5th in strikeout-to-walk ratio.
Darvish finished 2nd in strikeouts per 9 IP, ahed of Verlander (who was 3rd, recall). But he only pitched 191 innings and did not make the top 10 in ERA+ or strikeout-to-walk ratio.
I have not mentioned Peavy, Sale, Harrison or Kuroda. But I think Verlander would also compare very well to those guys. Verlander seems to more consistently rank high in meaningful stats than all the rest. So he would be a great choice.
Verlander led the league in IP and strikeouts and was 2nd in ERA to Price (2.56 vs. 2.64). Verlander had 238 IP while Price had 211.
He was 2nd to Weaver in WHIP (1.018 vs. 1.057).
He was 2nd to Weaver in hits per 9 IP (7.012 vs. 7.25). Price was 4th, Sabathia was not in the top 10.
He was 2nd to Sabathia strikeout-to-walk ratio (4.477 vs. 3.983). Price is not in the top 10. Weaver is not in the top 10.
He was 5th in HRs per 9 IP. Price is 4th. Sabathia is not in the top 10. Weaver is not in the top 10.
He was 3rd in strikeouts per 9 IP. Sabathia was 6th and Price was Price was 8th. Weaver is not in the top 10.
A reasonable objection to Verlander is that he might have been helped by his fielders. But look at how well he did in HR per 9 IP, strikeouts per 9 IP, and strikeout-to-walk ratio. So he did very well in "fielding independent" stats.
Now Verlander did not make the top 10 in walks per 9 IP (he had 2.3). Sabathia (4th, 1.98) and Weaver (7th, 2.147) did. But he beats both of them by a wide margin in IP. Weaver had 188 and Sabathia had 200.
His park could have helped him. But here is where one of the simpler sabermetric stats comes in handy. ERA+, which takes into account park effects and the league average. Verlaner led the league with 160 (meaning he was 60% better than the league average). Price was 2nd with 149. So a very solid lead for Verlander. Weaver had 134 and Sabathia had 124.
His teammate Scherzer led the league in strikeouts per 9 IP. But Scherzer did not make the top 10 in IP, HR per 9 IP, or ERA+ and was just 5th in strikeout-to-walk ratio.
Darvish finished 2nd in strikeouts per 9 IP, ahed of Verlander (who was 3rd, recall). But he only pitched 191 innings and did not make the top 10 in ERA+ or strikeout-to-walk ratio.
I have not mentioned Peavy, Sale, Harrison or Kuroda. But I think Verlander would also compare very well to those guys. Verlander seems to more consistently rank high in meaningful stats than all the rest. So he would be a great choice.
Sunday, November 4, 2012
Did Darwin Barney And Brendan Ryan Go Into Fielding Slumps The Last Two Months Of The Season?
As of August 1st, Barney had 3.3 defensive WAR (in 99 games) and Ryan had 3.2 (in 95 games). But Barney finished with a defensive WAR of 3.6, meaning he only got .3 in his last 57 games. Ryan also finished with 3.6, meaning he got .3 in his last 46 games. Does anyone know what happened? Did they make more errors? Did they get to fewer balls? Their pace sure fell off quite a bit. But they both finished tied for the 38th best fielding season ever with 13 other players.
Wednesday, October 31, 2012
Trout's 10.7 WAR Ties 20th Best Season Ever
That is the Baseball Reference ranking. He is tied with Mays (1964) and Ted Williams (1946)
Click here to see their rank for position players.
The only players to ever have a better season were
Ruth
Hornsby
Yastrzemski
Bonds
Gehrig
Ripken
Wagner
Cobb
Mantle
Mays
Morgan
Musial
Per game (he played in 139 and in one game he was just a pinch runner), he had .0770 WAR. That would be 9th best ever. See Mike Trout's WAR Per Game Is Historically One Of The Best (So Far).
He also had, not surpringly, the best rookie season ever. See Does Mike Trout Already Have One Of The Top Ten Rookie Seasons Ever?
To see the top seasons ever in WAR from Fangraphs, go to Best WAR Seasons For Position Players-Fangraphs. (thanks to David Appelman) They give Trout 10.0 and that is tied for 83rd best every. But, recall he only played 139 games. The average games played for the top 30 is 150. If Trout had played that many and had racked up the same rate of WAR per game, he would have had 10.8, good enough for 43rd.
Click here to see their rank for position players.
The only players to ever have a better season were
Ruth
Hornsby
Yastrzemski
Bonds
Gehrig
Ripken
Wagner
Cobb
Mantle
Mays
Morgan
Musial
Per game (he played in 139 and in one game he was just a pinch runner), he had .0770 WAR. That would be 9th best ever. See Mike Trout's WAR Per Game Is Historically One Of The Best (So Far).
He also had, not surpringly, the best rookie season ever. See Does Mike Trout Already Have One Of The Top Ten Rookie Seasons Ever?
To see the top seasons ever in WAR from Fangraphs, go to Best WAR Seasons For Position Players-Fangraphs. (thanks to David Appelman) They give Trout 10.0 and that is tied for 83rd best every. But, recall he only played 139 games. The average games played for the top 30 is 150. If Trout had played that many and had racked up the same rate of WAR per game, he would have had 10.8, good enough for 43rd.
Saturday, October 20, 2012
How Surprising Was Zito's Performance?
He has not pitched well on the road this year or well against righties while the Cards hit very well at home and very well against lefties (more info below on this).
With the Giants down 3-1 in the series, he pitched 7.2 innings with 6 hits, 6 K's, 1 BB (intentional) and zero runs. That gives him a "game score" (a Bill James stat) of 72. Here is how it is calculated
1.Start with 50 points.
2.Add 1 point for each out recorded, so 3 points for every complete inning pitched.
3.Add 2 points for each inning completed after the 4th.
4.Add 1 point for each strikeout.
5.Subtract 2 points for each hit allowed.
6.Subtract 4 points for each earned run allowed.
7.Subtract 2 points for each unearned run allowed.
8.Subtract 1 point for each walk.
In 32 starts during the regular season, he had an average game score of 49.53 (I came up with an average game score of 46.4 in the NL this year, so Zito was not much better than that).
He is not a big game pitcher, either. His start against the Reds in the division series had a game score of 42. His previous 8 playoff starts averaged 55.13. Only 3 were 68 or higher with a high of 79 (way back in 2001).
It is not like he came on at the end of the season, either. His average game score was 51.38 in his last 13 starts with a high of 66 and only 4 60+ games.
He did have 4 starts this year with a game score of 72 or higher. But those were generally against below average hitting teams.
83 vs. Colorado (in Denver). Rockies OPS+ this year as 91
78 vs. Cubs at home. Cubs OPS+ was 85
74 vs. Braves in Atl. Braves OPS+ was 90
72 vs. Dodgers at home. Dodgers OPS+ was 90
(according to Baseball Reference, the NL league average OPS+ was 94, not 100 for some reason).
The Cardinals were tied for 1st in OPS+ this year with 107 (tied with Giants). Zito had an ERA+ this year of 84. He was hurt last year and only pitched 53 innings. In 2010, his ERA+ was 94.
The Cards had an OPS at home of .786 and .731 on the road while the league average was .718. They had .787 vs lefties but .835 vs. lefty starters. Zito allowed an OPS at home of .726 and .796 on the road. It was .823 vs. righties and .559 vs. lefties (the Cards started 5 righties, a switch hitter and 2 lefties).
Now in his career it is .705 vs. righties and .701 vs. lefties, so maybe righties don't especially bother him. But this year he gave up 1 HR per 9 IP, which was the league average. His SO/BB ratio was 1.63, far below the league average of 2.50. I doubt anyone could have expected his performance last night. He is hardly an ace or stopper.
The average game score by a lefty during the regular season against the Cards was 45.8. The highest by a lefty in Busch was 60 (Bumgarner). So Zito was well above both of those.
Only 3 Lefty pitchers during the regular season had a game score of 72 or higher against the Cards (out of 45 starts)
Johan Santana 90
Gio Gonzalez 82
Clayton Kershaw 79
In the Division series, Gio Gonzalez had 55 and 46. I don't think the Nats had any other lefty starters. Bumgarner had 22 in game 1. I think that is all the lefty starts agains the Cards in the playoffs besides Zito. Did I miss any?
With the Giants down 3-1 in the series, he pitched 7.2 innings with 6 hits, 6 K's, 1 BB (intentional) and zero runs. That gives him a "game score" (a Bill James stat) of 72. Here is how it is calculated
1.Start with 50 points.
2.Add 1 point for each out recorded, so 3 points for every complete inning pitched.
3.Add 2 points for each inning completed after the 4th.
4.Add 1 point for each strikeout.
5.Subtract 2 points for each hit allowed.
6.Subtract 4 points for each earned run allowed.
7.Subtract 2 points for each unearned run allowed.
8.Subtract 1 point for each walk.
In 32 starts during the regular season, he had an average game score of 49.53 (I came up with an average game score of 46.4 in the NL this year, so Zito was not much better than that).
He is not a big game pitcher, either. His start against the Reds in the division series had a game score of 42. His previous 8 playoff starts averaged 55.13. Only 3 were 68 or higher with a high of 79 (way back in 2001).
It is not like he came on at the end of the season, either. His average game score was 51.38 in his last 13 starts with a high of 66 and only 4 60+ games.
He did have 4 starts this year with a game score of 72 or higher. But those were generally against below average hitting teams.
83 vs. Colorado (in Denver). Rockies OPS+ this year as 91
78 vs. Cubs at home. Cubs OPS+ was 85
74 vs. Braves in Atl. Braves OPS+ was 90
72 vs. Dodgers at home. Dodgers OPS+ was 90
(according to Baseball Reference, the NL league average OPS+ was 94, not 100 for some reason).
The Cardinals were tied for 1st in OPS+ this year with 107 (tied with Giants). Zito had an ERA+ this year of 84. He was hurt last year and only pitched 53 innings. In 2010, his ERA+ was 94.
The Cards had an OPS at home of .786 and .731 on the road while the league average was .718. They had .787 vs lefties but .835 vs. lefty starters. Zito allowed an OPS at home of .726 and .796 on the road. It was .823 vs. righties and .559 vs. lefties (the Cards started 5 righties, a switch hitter and 2 lefties).
Now in his career it is .705 vs. righties and .701 vs. lefties, so maybe righties don't especially bother him. But this year he gave up 1 HR per 9 IP, which was the league average. His SO/BB ratio was 1.63, far below the league average of 2.50. I doubt anyone could have expected his performance last night. He is hardly an ace or stopper.
The average game score by a lefty during the regular season against the Cards was 45.8. The highest by a lefty in Busch was 60 (Bumgarner). So Zito was well above both of those.
Only 3 Lefty pitchers during the regular season had a game score of 72 or higher against the Cards (out of 45 starts)
Johan Santana 90
Gio Gonzalez 82
Clayton Kershaw 79
In the Division series, Gio Gonzalez had 55 and 46. I don't think the Nats had any other lefty starters. Bumgarner had 22 in game 1. I think that is all the lefty starts agains the Cards in the playoffs besides Zito. Did I miss any?
Tuesday, October 9, 2012
Giancarlo Stanton's Amazing Power Season
He hit 37 HRs in just 123 games, finishing 2nd to Ryan Braun's 41. Stanton also set the all-time record for most HRs in a season by a Panoramian (yes, all-time!) His SLG was .608 while his AVG was .290. That gives him an isolated power (ISO) of .318, which, as I will show below, is outstanding for a player his age.
But Marlins Park was not a good HR park this year. 113 HRs were hit there (by both teams) while 157 were hit in Marlin road games. So there were only 72% as many road HRs as at home. It is only one year, but that is a low HR park factor.
Stanton's ISO at home was .287 while on the road it was .357. He had 16 HRs at home in 247 ABs while on the road it was 21 in 202 ABs. I can't help wondering how he would do in a fair park. I don't know how symmetric Marlins Park is, so maybe righties were not hurt as much as lefties. But he has a big home/road differential.
The table below shows the top seasons in ISO relative to the league average by players who were 22 or younger who had at least 400 PAs. Williams gets 252 because .329/.130 = 2.52. That gets multiplied by 100
The rest of the top 15 include Bob Horner, Mel Ott, Jimmy Sheckard, Juan Gonzalez and Joe Jackson. So Stanton is in great company.
Stanton is one of just 3 guys to have an ISO of at least .275 in 2 different seasons at age 22 or younger. The next table shows all those seasons.
Other players with season of .250 or higher were Alex Rodriguez, Juan Gonzalez, Hal Trosky, Frank Robinson, Vladimir Guerrero, Bob Horner, Evan Longoria, Darryl Strawberry. Jimmie Foxx, Mel Ott, Joe DiMaggio and Ted Williams each had one more .250+ season to go along with those seen in the table.
Here are all the players who had 2 seasons of 30+ HRs at age 22 or younger
Albert Pujols
Alex Rodriguez
Bob Horner
Eddie Mathews
Frank Robinson
Giancarlo Stanton
Jimmie Foxx
Jose Canseco
Miguel Cabrera
Ted Williams
But Marlins Park was not a good HR park this year. 113 HRs were hit there (by both teams) while 157 were hit in Marlin road games. So there were only 72% as many road HRs as at home. It is only one year, but that is a low HR park factor.
Stanton's ISO at home was .287 while on the road it was .357. He had 16 HRs at home in 247 ABs while on the road it was 21 in 202 ABs. I can't help wondering how he would do in a fair park. I don't know how symmetric Marlins Park is, so maybe righties were not hurt as much as lefties. But he has a big home/road differential.
The table below shows the top seasons in ISO relative to the league average by players who were 22 or younger who had at least 400 PAs. Williams gets 252 because .329/.130 = 2.52. That gets multiplied by 100
The rest of the top 15 include Bob Horner, Mel Ott, Jimmy Sheckard, Juan Gonzalez and Joe Jackson. So Stanton is in great company.
Stanton is one of just 3 guys to have an ISO of at least .275 in 2 different seasons at age 22 or younger. The next table shows all those seasons.
Other players with season of .250 or higher were Alex Rodriguez, Juan Gonzalez, Hal Trosky, Frank Robinson, Vladimir Guerrero, Bob Horner, Evan Longoria, Darryl Strawberry. Jimmie Foxx, Mel Ott, Joe DiMaggio and Ted Williams each had one more .250+ season to go along with those seen in the table.
Here are all the players who had 2 seasons of 30+ HRs at age 22 or younger
Albert Pujols
Alex Rodriguez
Bob Horner
Eddie Mathews
Frank Robinson
Giancarlo Stanton
Jimmie Foxx
Jose Canseco
Miguel Cabrera
Ted Williams
Sunday, October 7, 2012
Pujols Had Worst September Ever
His AVG-OBP-SLG in Sept were .269-.315-.420. Those numbers are a bit of a surprise and a bit of a disappointment for the Angels given that he was over 1.000 in OPS in July and August and had .977 in June.
The table below shows his OPS+ for each month of his career.
At 104, his OPS+ is far below the next lowest ever for Sept (actually Sept/Oct). The next lowest was 143. It also looks like his 3rd lowest monthly OPS+ ever no matter what the month. In 8 of his 11 previous seasons, his Sept OPS+ was higher than what it was for the whole season. His worst differential had been -17 in 2003. Yet this year it was -37. So his Sept performance was very much out of character. Maybe a normal performance would not have helped the Angels as they finished 4 games out of the wild card.
Thursday, October 4, 2012
Trout Vs. Cabrerra: A Conventional Approach
Cabrerra beat Trout in AVG, .330-.326. If Trout had just 3 more hits, he bats .331. I think everyone agrees that Trout was a much better fielder. He probably took away at least 3 more hits than Cabrerra.
Trout had 49 SBs while Cabrerra had 4. How many SBs might a HR be worth? What if we said 7? That gives Trout 7 and Cabrerra .571. So if we had 6.3 HRs to Trouts total of 30. So that gets him to 36. Then Trout robbed 4-5 guys of HRs this year. So that puts him around 40 and very close to Cabrerra.
Cabrerra led the league in RBIs but Trout led in runs. That has to count for something. Trout was 20 ahead of Cabrerra here (yes, Cabrerra beats Trout 139-83 in RBIs)
Cabrerra grounded into 28 DPs to lead the league. His RBI/GDP ratio was 4.96. Trout grounded into just 7 DPs. His ratio was 11.86. When you calculate value, you have to count the good with the bad. Cabrerra's RBIs were costly in terms of GDPs. Not so for Trout. Even by the conventional stats, Trout looks pretty good.
Trout had 49 SBs while Cabrerra had 4. How many SBs might a HR be worth? What if we said 7? That gives Trout 7 and Cabrerra .571. So if we had 6.3 HRs to Trouts total of 30. So that gets him to 36. Then Trout robbed 4-5 guys of HRs this year. So that puts him around 40 and very close to Cabrerra.
Cabrerra led the league in RBIs but Trout led in runs. That has to count for something. Trout was 20 ahead of Cabrerra here (yes, Cabrerra beats Trout 139-83 in RBIs)
Cabrerra grounded into 28 DPs to lead the league. His RBI/GDP ratio was 4.96. Trout grounded into just 7 DPs. His ratio was 11.86. When you calculate value, you have to count the good with the bad. Cabrerra's RBIs were costly in terms of GDPs. Not so for Trout. Even by the conventional stats, Trout looks pretty good.
Wednesday, October 3, 2012
Trout Leads League In OPS+ And SBs And Runs
Sort of a triple crown. I found only 5 other players since 1901 who led the league in OPS+ and SBs in the same season
Cobb
Wagner
Henderson
Mays
Stirnweiss
Some of them did it more than once. They all had at least one of those years as the runs scored leader, too. Stirnweiss did it in a war year, 1945. Don't forget that Trout had only 5 CS to go along with his 49 SBs. Probably the best % of any of these guys (although these days the league average is high so I should look into doing it relative to the league average).
I searched this by realizing that 15 SBs was the lowest league leading total and 144 was the lowest OPS+ leader. Then I had the Baseball Reference Play Index call up all the guys who had those numbers as a minimum. There were 383 cases and I scanned for bold black on SBs for the leaders and found these guys.
Trout went 2 for 3 tonight with a HBP while Cabrerra went 0 for 2. Trout led him in OPS+ 169-167 before tonight. Trout did not steal any bases (had 1 CS). Rajai Davis had 1 SB to get to 46. Trout entered the night with a 129-109 lead in runs scored over Cabrerra.
Cobb
Wagner
Henderson
Mays
Stirnweiss
Some of them did it more than once. They all had at least one of those years as the runs scored leader, too. Stirnweiss did it in a war year, 1945. Don't forget that Trout had only 5 CS to go along with his 49 SBs. Probably the best % of any of these guys (although these days the league average is high so I should look into doing it relative to the league average).
I searched this by realizing that 15 SBs was the lowest league leading total and 144 was the lowest OPS+ leader. Then I had the Baseball Reference Play Index call up all the guys who had those numbers as a minimum. There were 383 cases and I scanned for bold black on SBs for the leaders and found these guys.
Trout went 2 for 3 tonight with a HBP while Cabrerra went 0 for 2. Trout led him in OPS+ 169-167 before tonight. Trout did not steal any bases (had 1 CS). Rajai Davis had 1 SB to get to 46. Trout entered the night with a 129-109 lead in runs scored over Cabrerra.
Braun Is 2nd Player With 2 Straight Seasons Of 30+ HRs, 100+ RBIs, 30+SBs And A .300+ AVG
Vladimir Guerrero was the first in 2001-2002. Barry Bonds had 3 such seasons and he is the only other guy to do it more than once.
Sunday, September 30, 2012
Trout Becomes Youngest Ever To Get 30+ HRs & 30+ SBs In A Season
He just hit his 30th HR against the Rangers. Alex Rodriguez was previously the youngest at age 22 (actually a 40-40 season). Trout was 20 as of June 30.
Saturday, September 29, 2012
Torii Hunter May Make The Top 10 in WAR For The First Time At Age 36
He is currently 6th in the AL in WAR. He has never finished in the top 10 before and he is 36 (or was as of June 30). Off the top of my head, I can't think of anyone who might have cracked the top 10 for the 1st time so late in his career. Who else might have done something like this?
He has 5.1 and 10th place has 4.7 (Pujols). So with only 5 games left, it looks like he will make it. His highest WAR before this was 5.0 in 2009.
For ages 36 and older, a WAR of 5.0 or higher has only been reached 47 times. Randy Velarde was 4th in the AL in 1999 with a 6.7 at age 36. It was his only top 10 finish ever. I think his next best year was 3.2.
Al Oliver made it for the first time in 1982 at age 35. He was 10th in the NL with 5.7.
He has 5.1 and 10th place has 4.7 (Pujols). So with only 5 games left, it looks like he will make it. His highest WAR before this was 5.0 in 2009.
For ages 36 and older, a WAR of 5.0 or higher has only been reached 47 times. Randy Velarde was 4th in the AL in 1999 with a 6.7 at age 36. It was his only top 10 finish ever. I think his next best year was 3.2.
Al Oliver made it for the first time in 1982 at age 35. He was 10th in the NL with 5.7.
Chipper Jones Is In A League All By Himself
He is the only player with a career AVG of at least .300, 1000+ XBH, 1500+ BBs, 150+ SBs and 1500+ RBIs (Barry Bonds just missed it with a .298 AVG).
Friday, September 28, 2012
Through 1990, Who Were The Only 3 Players With 1000+ RBIs, 250+ HRs, 250+ SBs and 2500+ Hits?
Answer tomorrow. It was fun for me to discover who they were. Two will seem obvious but the third one might not. I imagine alot of people will go to Baseball Reference or use the Lee Sinins Complete Baseball Encyclopedia. Two are among the all-time greats (one is a household name while the other is among baseball fans, too) while the 3rd was just very good and is probably not a household name and maybe never was.
I did this search because a question came up in the Hornsby chapter of SABR. Who are the only two guys with 1200+ RBIs, 250+ HRs, 300+ SBs and 3000+ Hits?
Answer: Willie Mays, Joe Morgan and Vada Pinson
I did this search because a question came up in the Hornsby chapter of SABR. Who are the only two guys with 1200+ RBIs, 250+ HRs, 300+ SBs and 3000+ Hits?
Answer: Willie Mays, Joe Morgan and Vada Pinson
Thursday, September 27, 2012
Who Was The Most Surprising Triple Crown Winner?
This is similar to a couple of posts that I did last April. See Who Was The Least Likely Triple Crown Winner? and Baseball's Elite, Its Millionaires.
In those posts I used all of a player's career stats to determine the rankings (Ruth was the most likely to do it among the guys who never did). Here I looked at each guy who won the triple crown but his rating was based only on what he did before his triple crown season. For Williams and Hornsby, I used their first time (I also only looked at guys since 1900 this time).
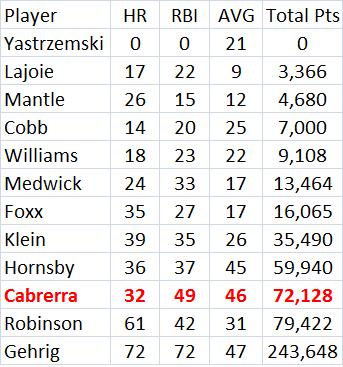
A player would get 10 points for each time he led his league in HRs, 9 for a 2nd place, etc. The same was done for AVG and RBIs. So the player had a career total number of points for each stat. A tie for 1st was still worth 10 points. Then those three numbers were multiplied times each other (meaning if a player never finished in the top 10 in one of these stats, his total will be zero).
So Yastrzemski was the most surprising. He did not make the top 10 in either HRs or RBIs in his six seasons before he won the triple crown (he was also the least likely to win using career data since 1900). Cabrerra would not be that big of a surprise, especially considering that he has led the league in all three stats in different years already. Gehrig was not a surprise at all he had been in the league leaders for several years in all three stats many times. Maybe his age of 31 made it a little more surprising. But it is not like his career was in decline before that.
A player would get 10 points for each time he led his league in HRs, 9 for a 2nd place, etc. The same was done for AVG and RBIs. So the player had a career total number of points for each stat. A tie for 1st was still worth 10 points. Then those three numbers were multiplied times each other (meaning if a player never finished in the top 10 in one of these stats, his total will be zero).
So Yastrzemski was the most surprising. He did not make the top 10 in either HRs or RBIs in his six seasons before he won the triple crown (he was also the least likely to win using career data since 1900). Cabrerra would not be that big of a surprise, especially considering that he has led the league in all three stats in different years already. Gehrig was not a surprise at all he had been in the league leaders for several years in all three stats many times. Maybe his age of 31 made it a little more surprising. But it is not like his career was in decline before that.
Monday, September 17, 2012
Is DeWayne Wise?
Maybe as wise as Fred Merkle. At least the White Sox won't lose a playoff spot or first place finish in this case. Check what happened in the 8th inning today.
Tuesday, September 11, 2012
Chris Sale vs. Stephen Strasburg
BR means Baseball Reference and FG means Fangraphs. I don't know why they are so different on WAR. I also don't know if FIP, xFIP, Sierra and tERA are park adjusted. It looks like BR gives Sale about a 106 for pitching in U.S. Cellular Field and Strasburg does not seem to get adjusted much, so his park must be neutral. So for the league %'s on FIP, xFIP, Sierra and tERA, we could multiply what Sale has by about .94. He would still be higher than Strasburg, but a little closer.
Sunday, September 9, 2012
Trout's Season Now In Top 50 In WAR
He is at 9.9, tying him for the 47th best season with Ernie Banks (1959) and Rogers Hornsby (1927). Trout bats leadoff and last year in the AL leadoff men got 6-7% more walks + ABs than a cleanup hitter (I guess that most of the great seasons were by 3 and 4 hitters). Should we reduce his offensive WAR by that much to equalize things? I don't know, but even if we did, it would only lower his offensive WAR to 6.862 (I lowered it 6%). But with his defensive WAR of 2.7, it would still leave him with a WAR of 9.5-9.6, tied for no worse than 64th. If we stick with his WAR of 9.9, the only players to ever have a better season than that who are not in the Hall of Fame are Barry Bonds, Sammy Sosa and Alex Rodriguez.
Update: Through games of Sept. 10, he is at 10.2. That is tied for the 28th best season ever. Fangraphs has him at "only" 8.6. But that is just in 118 games. If he did that for 162 games, it would be 11.8, good enough for the 23rd best season ever at Fangraphs. Over 154 games, it would be 11.2, tied for the 32nd best season ever. Going back to Baseball Reference, if Trout kept up his pace this year for 162 games, he would have 14 WAR, beating Ruth's record of 13.7 in 1923. Over 154 games. Trout would get 13.3 and that would be 2nd to Ruth. If Trout keeps up his current pace over the last 21 games, he will finish with a WAR of about 12. That would tie Hornsby and Yastrzemski for the 4th best season ever. Trout had one game where he pinch ran in the 8th inning and the game ended in the 9th. He had no putouts or PAs or SBs.
Update: Through games of Sept. 11 he is at10.4, tied for the 24th best season ever with Yount (1982) and Bonds (2004). If he can make it to 11.4, he will crack the top 10. Not too easy, since it would be a WAR of about 1.0 in 20 games or 8 for a full season. He is obviously capable of that, of course.
Update: Through games of Sept. 20 he is at 10.1. Over his last 8 games, he has been .3 below replacement. He was 6 for 30 in those 8 games with just 1 extra-base hit (2B), 5 BBs and 1 SB.
Update: Through games of Sept. 22 he is at 10.4.
Update: Through games of Sept. 26 he is at 10.6. That is tied for 22nd with Ty Cobb (1911) and Rogers Hornsby (1921). Trout has only played 132 games this year. Only 12 players have ever had a season of 10.6 or higher before Trout. They are
Ruth
Bonds
Ripken
Yastrzemski
Wagner
Morgan
Gehrig
Mantle
Hornsby
Musial
Williams
Mays
Update: Through games of Sept. 27 he is back down to 10.5. So he falls to 24th place.
Update: Through games of Sept. 28 he is back down to 10.4 even though he was 2 for 5 with a HR and a 3B. So he falls to a tie for 24th place.
Update: Through games of Sept. 30 he is back up to 10.5. The Angels played a doubleheader on Sept 30 after being rained out the day before.
Update: Through games of Oct. 1 he is up to 10.7. That is tied for 20th with Mays (1964) and Williams (1946)
Update: Through games of Sept. 10, he is at 10.2. That is tied for the 28th best season ever. Fangraphs has him at "only" 8.6. But that is just in 118 games. If he did that for 162 games, it would be 11.8, good enough for the 23rd best season ever at Fangraphs. Over 154 games, it would be 11.2, tied for the 32nd best season ever. Going back to Baseball Reference, if Trout kept up his pace this year for 162 games, he would have 14 WAR, beating Ruth's record of 13.7 in 1923. Over 154 games. Trout would get 13.3 and that would be 2nd to Ruth. If Trout keeps up his current pace over the last 21 games, he will finish with a WAR of about 12. That would tie Hornsby and Yastrzemski for the 4th best season ever. Trout had one game where he pinch ran in the 8th inning and the game ended in the 9th. He had no putouts or PAs or SBs.
Update: Through games of Sept. 11 he is at10.4, tied for the 24th best season ever with Yount (1982) and Bonds (2004). If he can make it to 11.4, he will crack the top 10. Not too easy, since it would be a WAR of about 1.0 in 20 games or 8 for a full season. He is obviously capable of that, of course.
Update: Through games of Sept. 20 he is at 10.1. Over his last 8 games, he has been .3 below replacement. He was 6 for 30 in those 8 games with just 1 extra-base hit (2B), 5 BBs and 1 SB.
Update: Through games of Sept. 22 he is at 10.4.
Update: Through games of Sept. 26 he is at 10.6. That is tied for 22nd with Ty Cobb (1911) and Rogers Hornsby (1921). Trout has only played 132 games this year. Only 12 players have ever had a season of 10.6 or higher before Trout. They are
Ruth
Bonds
Ripken
Yastrzemski
Wagner
Morgan
Gehrig
Mantle
Hornsby
Musial
Williams
Mays
Update: Through games of Sept. 27 he is back down to 10.5. So he falls to 24th place.
Update: Through games of Sept. 28 he is back down to 10.4 even though he was 2 for 5 with a HR and a 3B. So he falls to a tie for 24th place.
Update: Through games of Sept. 30 he is back up to 10.5. The Angels played a doubleheader on Sept 30 after being rained out the day before.
Update: Through games of Oct. 1 he is up to 10.7. That is tied for 20th with Mays (1964) and Williams (1946)
Wednesday, September 5, 2012
One Possible Key To The Orioles
They are now tied for 1st place with the Yankees yet they have a run differential of -19. Their record is 76-59 and 24-7 in 1-run games. Here is one thing that might be the difference. Their batters have an OPS of .722 while their pitchers have allowed an OPS of .724. That should give them just about a .500 record. But in close and late situations their batters have an OPS of .697 (probably a typical dropoff) but their pitchers allow just a .598 OPS. Maybe that is why they wins so many close games.
In the AL this year the overall batting OPS is .733. In CL situations it is .683. So the Orioles only drop off .035, not the norm of .050. For AL pitchers, the overall OPS allowed is .729. In CL cases it is .674. So the Oriole drop off is .126 while it is just .055 for the league.
In non-CL situations the Orioles have about a .727 OPS and their pitchers allow a .747 OPS. Here is my formula for predicting winning pct. using non-CL OPS and CL OPS (both for batters and what is allowed)
PCT = 0.501 + 0.918*NONCLOPS + 0.345*CLOPS - 0.845*OPPNONCLOPS - 0.421*OPPCLOPS
That would give them a .526 Pct. Then they should have 71 wins but they really have 76. So there are still 5 wins not explained.
Baseball Reference gives the Orioles hitters a clutch rating of 2.9, meaning that they tend to hit better the more runners on base, the closer the score and the later the game. So they have won 2.9 more games than you would expect from their hitting than you would normally expect. Pitchers have 6.8. That adds up to 9.7. If they were to win only half their games, it would be 67.5. But if you add 9.8 to that you get 77.3. Very close to their actual win total of 76. They just perform better when it matters more.
In the AL this year the overall batting OPS is .733. In CL situations it is .683. So the Orioles only drop off .035, not the norm of .050. For AL pitchers, the overall OPS allowed is .729. In CL cases it is .674. So the Oriole drop off is .126 while it is just .055 for the league.
In non-CL situations the Orioles have about a .727 OPS and their pitchers allow a .747 OPS. Here is my formula for predicting winning pct. using non-CL OPS and CL OPS (both for batters and what is allowed)
PCT = 0.501 + 0.918*NONCLOPS + 0.345*CLOPS - 0.845*OPPNONCLOPS - 0.421*OPPCLOPS
That would give them a .526 Pct. Then they should have 71 wins but they really have 76. So there are still 5 wins not explained.
Baseball Reference gives the Orioles hitters a clutch rating of 2.9, meaning that they tend to hit better the more runners on base, the closer the score and the later the game. So they have won 2.9 more games than you would expect from their hitting than you would normally expect. Pitchers have 6.8. That adds up to 9.7. If they were to win only half their games, it would be 67.5. But if you add 9.8 to that you get 77.3. Very close to their actual win total of 76. They just perform better when it matters more.
Sunday, September 2, 2012
Chipper Jones In Rare Company With 1000+ Extra-base Hits, 1000+ Wallks And A .300+ AVG
The list is below. Only 17 players have dones this and the numbers are only through 2011. Jones still has a .304 lifetime AVG. AROD is down to .301. All 12 of the eligible players on this list are in the Hall of Fame. The non-eligibles are in red. To be on this list you need power, patience and the ability to hit for average.
Wednesday, August 29, 2012
Mike Trout's Season Is Now In The Top 100 Of All-Time And It Looks Like It Is Now The Greatest Rookie Season Ever
He now has a WAR of 9.1. Click here to see the leaders. Trout is tied for 94th. Actually 94th-103rd. He also is 2nd only to Babe Ruth's 1923 season in WAR per game (.0858). Click here to see that list. If Trout could get just .0429 WAR per game over the last 33 games, he would add 1.4 WAR. He would finish with 10.5. That would be the 24th highest ever.
Click here to see the rookie list.. I think Joe Jackson has the previous best rookie season at a WAR of 9.0.
Update: Through Aug. 30, Trout has slipped to 8.9 WAR
Update: Through Aug. 31, Trout is up to 9.2 WAR
Click here to see the rookie list.. I think Joe Jackson has the previous best rookie season at a WAR of 9.0.
Update: Through Aug. 30, Trout has slipped to 8.9 WAR
Update: Through Aug. 31, Trout is up to 9.2 WAR
Tuesday, August 28, 2012
Who Was The Greatest "All-Around" Player Ever? Another Quantitative Attempt (Part 3)
Part 2 is below with a link to part 1. I used four stats: one for fielding, one for speed (based on triples), one for hitting for average and one for hitting for power (ISO). The four stats were multiplied by each other and I calculated their geometric mean. Players had to have 5000+ career PAs. They are relative to the league average and there is a park adjustment.
I have already used both a triples stat and then a SB stat to measure speed. Here I combined them. I used the square root of the SB stat (see earlier posts for how that worked). Then that was added to the triples stat and I simply took the average of the two. One reason I took the square root of the SB stat is that it had a very large range and this brings it more in line with the other stats. This is actually similar to what Bill James does with his "speed score." One of his stats in that involves SBs and he takes the square root of it. He also uses triples. But I don't use fielding range factor, partly because it would be hard to get it for each guy but also I am already using fielding here. I don't uses CS or GIDP since we don't have them for all of history. I don't use runs scored since that depends on your teammates.
So here is the top 25.
Here are the numbers for Mays. Recall that they are relative to the leage average:
Fielding: 1.13
Isolated Power: 1.89
Average: 1.14
Speed: 1.49
Mays got a slight bumb from the park adjustment (an increase of 2%). For the above replacement level version here are the leaders (this was done the same way as in the first two posts). Mays has a solid lead. He has been the best or near the top so far in all the ways I have looked at this.
http://cybermetric.blogspot.com/2012/08/who-was-greatest-all-around-player-ever_23.html
http://cybermetric.blogspot.com/2012/08/who-was-greatest-all-around-player-ever.html
I have already used both a triples stat and then a SB stat to measure speed. Here I combined them. I used the square root of the SB stat (see earlier posts for how that worked). Then that was added to the triples stat and I simply took the average of the two. One reason I took the square root of the SB stat is that it had a very large range and this brings it more in line with the other stats. This is actually similar to what Bill James does with his "speed score." One of his stats in that involves SBs and he takes the square root of it. He also uses triples. But I don't use fielding range factor, partly because it would be hard to get it for each guy but also I am already using fielding here. I don't uses CS or GIDP since we don't have them for all of history. I don't use runs scored since that depends on your teammates.
So here is the top 25.
Here are the numbers for Mays. Recall that they are relative to the leage average:
Fielding: 1.13
Isolated Power: 1.89
Average: 1.14
Speed: 1.49
Mays got a slight bumb from the park adjustment (an increase of 2%). For the above replacement level version here are the leaders (this was done the same way as in the first two posts). Mays has a solid lead. He has been the best or near the top so far in all the ways I have looked at this.
http://cybermetric.blogspot.com/2012/08/who-was-greatest-all-around-player-ever_23.html
http://cybermetric.blogspot.com/2012/08/who-was-greatest-all-around-player-ever.html
Thursday, August 23, 2012
Who Was The Greatest "All-Around" Player Ever? Another Quantitative Attempt (Part 2)
To see Part 1, go to Who Was The Greatest "All-Around" Player Ever? Another Quantitative Attempt.
I used four stats: one for fielding, one for speed (based on triples), one for hitting for average and one for hitting for power (ISO). There was a park adjustment, too. The four stats were multiplied by each other and I calculated their geometric mean. Players had to have 5000+ career PAs.
In this case, I used a stat for stolen bases for speed instead of the one for triples. Because of that, the isolated power stat here was not adjusted for triples like I did the first time. The stolen base stat is SBs divided by number of times reaching first base (singles + walks + HBP). That was then divided by the league average. The next post I do will combine triples and SBs to make a speed stat. I think that neither a SB stat nor a triples stat are good enough by themselves.
So here is the new set of leaders. The 1.57 for Bobby Bonds means that the geometric average of the 4 stats was 1.57. If, for example, he had been 57% better than the league average in each of the 4 stats, his geometric average would have been 1.57. His stats were actually
Fielding: 1.08
Isolated Power: 1.63
Batting Average: 1.03
SBs: 3.41
He was 8% better at fielding. His SB rate was 3.41 times the league average.
Willie Mays once again does extremely well (Bobby Bonds was 23rd before). He was 3rd in the other measure using 3Bs for speed. DiMaggio was first. But here he fell to 449th. His stealing rate was only .37. Rickey Henderson rose from 284th place since he did not have very many triples (he was just about average). So some players moved up or down in the rankings quite a bit. The SB rate had a bigger range than the SB rate (although the correlation between the two rates was about .56). It went from 5.35 down to 0.019. The triple rate ranged from 3.85 down to 0.197.
I also calculated an "above replacement" level value, using the same method as last time. Here is the top 25. I don't think the number has any real meaning or interpretation. This just allows us to take into account longevity and the typical decline in performance that we normally see. Mays was 1st in this one last time. Mays probably would gain on Henderson if I could split fielding into throwing and catching (which I will try to do at some point). Would it be enough to pass Henderson? If so, I think it would strengthen the case for Mays being the greatest all around player ever since he ranks so high using either SBs or 3Bs for speed.
In this case, I used a stat for stolen bases for speed instead of the one for triples. Because of that, the isolated power stat here was not adjusted for triples like I did the first time. The stolen base stat is SBs divided by number of times reaching first base (singles + walks + HBP). That was then divided by the league average. The next post I do will combine triples and SBs to make a speed stat. I think that neither a SB stat nor a triples stat are good enough by themselves.
So here is the new set of leaders. The 1.57 for Bobby Bonds means that the geometric average of the 4 stats was 1.57. If, for example, he had been 57% better than the league average in each of the 4 stats, his geometric average would have been 1.57. His stats were actually
Fielding: 1.08
Isolated Power: 1.63
Batting Average: 1.03
SBs: 3.41
He was 8% better at fielding. His SB rate was 3.41 times the league average.
Willie Mays once again does extremely well (Bobby Bonds was 23rd before). He was 3rd in the other measure using 3Bs for speed. DiMaggio was first. But here he fell to 449th. His stealing rate was only .37. Rickey Henderson rose from 284th place since he did not have very many triples (he was just about average). So some players moved up or down in the rankings quite a bit. The SB rate had a bigger range than the SB rate (although the correlation between the two rates was about .56). It went from 5.35 down to 0.019. The triple rate ranged from 3.85 down to 0.197.
I also calculated an "above replacement" level value, using the same method as last time. Here is the top 25. I don't think the number has any real meaning or interpretation. This just allows us to take into account longevity and the typical decline in performance that we normally see. Mays was 1st in this one last time. Mays probably would gain on Henderson if I could split fielding into throwing and catching (which I will try to do at some point). Would it be enough to pass Henderson? If so, I think it would strengthen the case for Mays being the greatest all around player ever since he ranks so high using either SBs or 3Bs for speed.
Wednesday, August 22, 2012
Major League Baseball Could See Its 500,000th Error This Season!
According to Baseball Reference, since 1876, there have been 499,590 errors made. So only 410 to go. With 30 teams and about 40 games left for each, there are close to 1200 games left in the season. With a rate of .5-.6 errors per game, there should be around 600 more errors this season and we will pass the 500,000 mark.
There have also been 98,790 hit batters, so that could be passed in a couple of years.
Update: Jose Reyes made the 500,000th error on Sept. 15th. See Marlins' Jose Reyes fumbles way into history with baseball's 500,000th error by Jeff Passan. It also has a video clip.
There have also been 98,790 hit batters, so that could be passed in a couple of years.
Update: Jose Reyes made the 500,000th error on Sept. 15th. See Marlins' Jose Reyes fumbles way into history with baseball's 500,000th error by Jeff Passan. It also has a video clip.
Does Mike Trout Already Have The 2nd Highest WAR Ever For A Rookie?
I tried to compile a list of the best rookie seasons by WAR from Baseball Reference. See my earlier post from August 1, Does Mike Trout Already Have One Of The Top Ten Rookie Seasons Ever? Trout now has a WAR of 8.6. My list would have him 2nd only to Joe Jackson in 1911 (9.0). With almost 40 games left, it seems like he will pass that. He has gained 2.0 in WAR in the last 19 games.
He leads the 2nd best position player in the league, Robinson Cano, by 3.0 (Cano has 5.6). The last time a position player was 3.0 or more better for a whole season than the 2nd best position player was in 2002 when Barry Bonds had 11.6 and Jeff Kent had 6.9.
Tuesday, August 21, 2012
Is Alexei Ramirez A Good Offensive Player?
That is what the announcer said on ESPN's "Baseball Tonight" last night (it was not one of the ex-player analysts who said this). Here is how Ramirez has done in OPS+ in each year of his career:
2008-104
2009-86
2010-99
2011-94
2012-72
His career OPS+ is 92. His career OBP is .317 and this year it is .282. He is not making up for it with base stealing. He does have 14 SBs with only 5 CS this year. But that is of marginal importance and in his career his SB-CS is 61-32.
2008-104
2009-86
2010-99
2011-94
2012-72
His career OPS+ is 92. His career OBP is .317 and this year it is .282. He is not making up for it with base stealing. He does have 14 SBs with only 5 CS this year. But that is of marginal importance and in his career his SB-CS is 61-32.
Monday, August 20, 2012
Is Mike Trout Only The 6th Player To Have 20+ HRs and 35+ SBs In His First 100 Games Of A Season?
He has 24 HRs and 39 SBs in 99 games so far. I called up all the seasons with 20+ HRs and 35+ SBs using the Lee Sinins "Complete Baseball Encyclopedia." 46 players have done this at least once. Then I went through all of those individual seasons and looked at their monthly & daily splits at Retrosheet & gamelogs at Baseball Reference. Here the only players I think have done this before:
Cesar Cedeno-1974
Joe Morgan-1976
Rickey Henderson-1985, 1990
Eric Davis-1986, 1987
Barry Bonds-1990
Let me know if you think I missed anyone. Trout has a good chance to get 30+ HRs and 50+ SBs. Only two players have ever done that, Barry Bonds and Eric Davis, each once.
Cesar Cedeno-1974
Joe Morgan-1976
Rickey Henderson-1985, 1990
Eric Davis-1986, 1987
Barry Bonds-1990
Let me know if you think I missed anyone. Trout has a good chance to get 30+ HRs and 50+ SBs. Only two players have ever done that, Barry Bonds and Eric Davis, each once.
Thursday, August 16, 2012
Update On Mike Trout's Historic WAR Per Game
10 games ago, I reported that Trout had a WAR per game of .0859 (he had 7.3 WAR in 85 games). He now has 8.1 WAR in 95 games or .0853 per game. That is still 2nd only to Ruth's .0901 in 1923 (since 1900). Trout has .08 WAR per game over his last 10 games. If a player did that for a whole season, it would still be the 7th best year since 1900. See Mike Trout's WAR Per Game Is Historically One Of The Best (So Far)
Wednesday, August 15, 2012
How Much Will The Loss Of Cabrera Hurt The Giants?
He has had about .043 WAR per game this year (assuming 4.5 PAs per game). So over the next 45 games, it would be 1.94. If Gregor Blanco takes over, he would get .76 WAR (he had been averaging about .017 WAR per game). So that is a loss of 1.18 wins. Of course, this is only based on this year's stats. Blanco was not in the majors last year and as of now, his career WAR per game is .01. Last year Cabrera had .026 WAR per game. It is hard to say what the real talent level of each guy is. But if I use the latter 2 numbers, it will cost the Giants .72 wins. If I average that with the 1.18, we get .95 wins. So still in the range of about one less win.
Thursday, August 9, 2012
Who Was The Greatest "All-Around" Player Ever? Another Quantitative Attempt
Some players are said to have 5 tools: they can hit for average, hit for power, run the bases, catch the ball and throw it. It might seems simple to come up with a rating for this-you could just add, say HRs and SBs. But a player who hits 500 HRs and has 0 SBs has less "all-around" ability than a guy that hits 200 HRs and steals 200 bases. If you added HRs + SBs, the first guy looks better.
So I will use a geomtric mean (Dan Levitt and Jim Baker made helpful comments-any mistakes, of course, are due solely to me).
Here is what Wikipedia says about it: "A geometric mean is often used when comparing different items- finding a single "figure of merit" for these items- when each item has multiple properties that have different numeric ranges." In fact, some of the values I will be using will have much larger ranges than others.
Here are the measures I will use:
Fielding: I use FRAA from the Lee Sinins Complete Baseball Encyclopedia (fielding runs above average). Sinins got them from Michael Humphreys' recent book Wizardry. I don't have a way of easily breaking this down into throwing (arm) and catching (glove), but I have something in mind that I will use in a future post. I converted it into a rate relative to the league average (like 1.10 means that you saved 10% more runs than average).
Hitting for Average: I will use average relative to the league average.
Hitting for Power: I will use isolated power relative to the league average.
Speed: I use a player's 3B/(2B + 3B) relative to the league average. This is an idea from Voros McCracken. The idea is that it is a % of the time you hit an extra-base hit that you get a 3B. The faster players will have a higher rate here. It is relative to the league average. Handedness is adjusted for. Triples were taken out of the relative isolated power calculation (for both the player and the league average) since they get used in the speed rating. Actually, for isolated power they were considered doubles. Both the speed and power ratings had ranges far beyond those of fielding and hitting for average.
A park adjustment was also made to each player's overall rating (this was based on hitting only).
The four ratings, each relative to the league average, are multiplied times each other and then I take the 4th root of that number (the geometric mean). I used all players who had 5000+ PAs through 2011. The table below shows the top 25.
Here is what Wikipedia says about it: "A geometric mean is often used when comparing different items- finding a single "figure of merit" for these items- when each item has multiple properties that have different numeric ranges." In fact, some of the values I will be using will have much larger ranges than others.
Here are the measures I will use:
Fielding: I use FRAA from the Lee Sinins Complete Baseball Encyclopedia (fielding runs above average). Sinins got them from Michael Humphreys' recent book Wizardry. I don't have a way of easily breaking this down into throwing (arm) and catching (glove), but I have something in mind that I will use in a future post. I converted it into a rate relative to the league average (like 1.10 means that you saved 10% more runs than average).
Hitting for Average: I will use average relative to the league average.
Hitting for Power: I will use isolated power relative to the league average.
Speed: I use a player's 3B/(2B + 3B) relative to the league average. This is an idea from Voros McCracken. The idea is that it is a % of the time you hit an extra-base hit that you get a 3B. The faster players will have a higher rate here. It is relative to the league average. Handedness is adjusted for. Triples were taken out of the relative isolated power calculation (for both the player and the league average) since they get used in the speed rating. Actually, for isolated power they were considered doubles. Both the speed and power ratings had ranges far beyond those of fielding and hitting for average.
A park adjustment was also made to each player's overall rating (this was based on hitting only).
The four ratings, each relative to the league average, are multiplied times each other and then I take the 4th root of that number (the geometric mean). I used all players who had 5000+ PAs through 2011. The table below shows the top 25.
Some players are not too surprising while others are. One possible weakness is that some players played long careers and in their later years, the averages and rates were dragged down. So I also tried to create a rating for "all-aroundness" above replacement level. If the average level would be 1.00, then replacement could be .8 (what I used). This might be reasonable because 80% of 81 is about 65 wins, an acceptable replacement level (if we want to go down to say 54 or 52 wins, we could assume that the replacement level pitchers would get you the rest of the way there-remember, these are only position players and their hitting, fielding and running).
So how was this calculated? Mays has 1.385. That minus .8 gets us .585. That is how far above replacement Mays was, qualitatively. To quantifiy this, I assumed a 700 plate appearance levl for a full season. Mays had about 17.85 full seasons. So that times .585 gets us 10.44. He is the leader here.
Alot of all-time greats here. But Steve Finley really jumps out as a surprise.
I hope to post more in the next week or two on some of the assumptions I made and how I came up with some of the measures. Other issues include using SBs instead of 3Bs for speed (Rickey Henderson would rank higher then), using HR% instead of isolated power, how park affects play a role in the 3B/(2B + 3B) rate, the handedness adjustment for that stat, including the ability to get a walk as a "tool" and the earlier mentioned issue of breaking up the fielding rating into throwing and catching (it is possible that someone got a good fielding rating and was not really well balanced, that is, it was all due to their arm or their glove). I also need to explain how I turned FRAA into a rate and how I adjusted for handedness in 3B/(2B + 3B). Same for how I calculated and used the park effect adjustment.
Tuesday, August 7, 2012
Chris Sale vs. Stephen Strasburg
BR means Baseball Reference and FG means Fangraphs. I don't know why they are so different on WAR. I also don't know if FIP, xFIP, Sierra and tERA are park adjusted. It looks like BR gives Sale about a 105 for pitching in U.S. Cellular Field and Strasburg does not seem to get adjusted much, so his park must be neutral. So for the league %'s on FIP, xFIP, Sierra and tERA, we could multiply what Sale has by about .95. He would still be higher than Strasburg, but a little closer.
Sunday, August 5, 2012
Mike Trout's WAR Per Game Is Historically One Of The Best (So Far)
Through yesterday's game, he had 7.3 WAR in 85 games. I found all the seasons with 7.3 or more WAR from 1901-1912 at Baseball Reference. Then ranked them by WAR per game. Trout is 2nd only to Ruth's 1923 season. Then I found the top 200 seasons in WAR from 1871-1900 and ranked them by WAR per game. The table below shows the top 10 from the two searches.
Thursday, August 2, 2012
Are Darwin Barney And Brendan Ryan Having Historic Fielding Seasons?
At Baseball Reference, Barney (Cubs) has 3.3 defensive WAR while Ryan (Mariners) has 3.2. With about a third of the season left, they are on a pace to get about 4.8-4.9 defensive WAR. Here are the top 4 seasons ever:
1. Terry Turner-5.4-1906
2. Art Fletcher-5.1-1917
3. Mark Belanger-4.9-1975
4. Ozzie Smith-4.7-1989
So far this year, after Barney and Ryan, the next highest defensive WAR belongs to Yunel Escobar of the Blue Jays with 2.2
1. Terry Turner-5.4-1906
2. Art Fletcher-5.1-1917
3. Mark Belanger-4.9-1975
4. Ozzie Smith-4.7-1989
So far this year, after Barney and Ryan, the next highest defensive WAR belongs to Yunel Escobar of the Blue Jays with 2.2
Wednesday, August 1, 2012
Does Mike Trout Already Have One Of The Top Ten Rookie Seasons Ever?
Using the Baseball Reference Play Index, I found the best seasons for anyone in their 1st, 2nd, 3rd, or 4th seasons. If a player had 130 or more career ABs before a given season, I no longer considered him a rookie (I think that is the rule and I think there is something also about days on the roster but I don't know how to find that). So here are what I think are the top 10 seasons ever for a rookie position player in WAR. Please let me know if you think anyone is missing. Notice how few games Trout has played, so it looks like he could pass Jackson.
MJ Lloyd of HaloHangout has a good post on how Trout compares to other great 20 year old players. See Mike Trout Is In Elite Company. AROD has the highest with 9.2 in 1996. So Trout could break that, too.
Friday, July 20, 2012
Doubles As A Percent Of All Hits Over Time
The graph below shows the numbers for the AL.
The trend has also been to a higher frequency of doubles. See The Fastest Players Since 1900 According to the Triple-to-Double Ratio
Now the NL
The trend has also been to a higher frequency of doubles. See The Fastest Players Since 1900 According to the Triple-to-Double Ratio
Friday, July 13, 2012
Why Are The Red Sox Just a .500 Team If They Have a +47 Run Differential And An OPS Differential of +.039?
They hit well with runners on base but their pitchers do very poorly with runners on base and both the hitters and pitchers do poorly when it is close and late. This post was inspired by what David Pinto wrote at "Baseball Musings." See WPA I Can Use. David's post was based on Tango's post WPA insights which in turn linked to Dave Studeman's article Detailed standings at the all-star break.
Here is what I posted at "Baseball Musings."
"They actually hit well with runners on base and RISP. Here are their BA-OBP-SLG-OPS with
RISP) 0.283 0.359 0.458 0.817
None on) 0.260 0.313 0.425 0.738
ROB) 0.279 0.349 0.463 0.813
Now their overall BA-OBP-SLG-OPS and in close and late situations
Overall) 0.268 0.329 0.441 0.770
CL) 0.241 0.310 0.383 0.693
How can a team which hits so well with runners on base do so poorly when it is close and late? Are they at a platoon disadvantage? Just bad luck?
Now the same thing for their pitchers
RISP) 0.256 0.343 0.432 0.775
None on) 0.265 0.341 0.431 0.772
ROB) 0.251 0.306 0.395 0.701
So it looks like their pitchers do much worse with runners on base.
Now their overall BA-OBP-SLG-OPS and in close and late situations
Overall) 0.257 0.321 0.410 0.731
CL) 0.271 0.335 0.403 0.738
So their pitchers do worse when it is close and late.
Overall, they have an OPS Differential of .039 (.770- .731). But when it is close and late the differential is negative. It is -.045 (.693 – .738)
Here is what I posted at "Baseball Musings."
"They actually hit well with runners on base and RISP. Here are their BA-OBP-SLG-OPS with
RISP) 0.283 0.359 0.458 0.817
None on) 0.260 0.313 0.425 0.738
ROB) 0.279 0.349 0.463 0.813
Now their overall BA-OBP-SLG-OPS and in close and late situations
Overall) 0.268 0.329 0.441 0.770
CL) 0.241 0.310 0.383 0.693
How can a team which hits so well with runners on base do so poorly when it is close and late? Are they at a platoon disadvantage? Just bad luck?
Now the same thing for their pitchers
RISP) 0.256 0.343 0.432 0.775
None on) 0.265 0.341 0.431 0.772
ROB) 0.251 0.306 0.395 0.701
So it looks like their pitchers do much worse with runners on base.
Now their overall BA-OBP-SLG-OPS and in close and late situations
Overall) 0.257 0.321 0.410 0.731
CL) 0.271 0.335 0.403 0.738
So their pitchers do worse when it is close and late.
Overall, they have an OPS Differential of .039 (.770- .731). But when it is close and late the differential is negative. It is -.045 (.693 – .738)
Wednesday, July 11, 2012
Is "Pitching To Contact" Helping The Nationals?
The Yahoo Sports baseball page has a feature article on this. It says "New alphabet: Fewer K's, more W's for Nats: Washington's emphasis on pitching to contact is paying off in victories." The article then is Nationals pitching coach Steve McCatty believes fewer K's equals more W's, and so far so good by Les Carpenter. I really don't see any statistical evidence offered to support this in the article.
This year the Nationals are 3rd in the NL in strikeouts per 9 IP with 8.3 and they have an ERA of 3.21. Last year they were 15th in the NL in strikeouts per 9 IP 6.5 and they had an ERA of 3.58. So it actually seems like they are striking out more batters and their ERA is lower.
This issue came up in April, 2011. See my post Can "Pitching To Contact" Lead To More Scoring? The Twins were supposedly benefiting from it. I was skeptical. Here is what I wrote:
"To look at this, I calculated the batting average and slugging percentage in the AL in 2010 on contact. For contact, I used AB - K + SF. I assumed that sacrifice hits (bunts) and their attempts rarely end up in strikeouts. So in the AL last year when a plate appearance ended in contact, the AVG was .320 and the SLG was .501.
How many runs per game might this lead to? To approximate this, I used the equation
R/G = 16.04*OBP + 11.595*SLG - 5.52
That comes from regression analysis based on the 2007-2009 seasons.
Last year the AL had a leage OBP of .327 and a league SLG of .407. The equation predicts that would lead to a runs per game of 4.44 (it was actually 4.45). But if we used .320 for OBP and used the .501 for SLG, we get 5.44 runs per game. That seems like a big difference.
I am not sure if this approximation works. It would be quite a different game with no walks and the denominator for OBP and SLG is not the same in each case. But even with that said, I am skeptical that pitching to contact (or not trying to cause batters to miss the pitch) is a good idea."
Jeff Sullivan of "Baseball Nation" has a good take on this. See Being Wrong, With The Nationals' Pitching Coach
Baseball Think Factory has an interesting discussion on this. See Nationals pitching coach Steve McCatty believes fewer K’s equals more W’s, and so far so good
This year the Nationals are 3rd in the NL in strikeouts per 9 IP with 8.3 and they have an ERA of 3.21. Last year they were 15th in the NL in strikeouts per 9 IP 6.5 and they had an ERA of 3.58. So it actually seems like they are striking out more batters and their ERA is lower.
This issue came up in April, 2011. See my post Can "Pitching To Contact" Lead To More Scoring? The Twins were supposedly benefiting from it. I was skeptical. Here is what I wrote:
"To look at this, I calculated the batting average and slugging percentage in the AL in 2010 on contact. For contact, I used AB - K + SF. I assumed that sacrifice hits (bunts) and their attempts rarely end up in strikeouts. So in the AL last year when a plate appearance ended in contact, the AVG was .320 and the SLG was .501.
How many runs per game might this lead to? To approximate this, I used the equation
R/G = 16.04*OBP + 11.595*SLG - 5.52
That comes from regression analysis based on the 2007-2009 seasons.
Last year the AL had a leage OBP of .327 and a league SLG of .407. The equation predicts that would lead to a runs per game of 4.44 (it was actually 4.45). But if we used .320 for OBP and used the .501 for SLG, we get 5.44 runs per game. That seems like a big difference.
I am not sure if this approximation works. It would be quite a different game with no walks and the denominator for OBP and SLG is not the same in each case. But even with that said, I am skeptical that pitching to contact (or not trying to cause batters to miss the pitch) is a good idea."
Jeff Sullivan of "Baseball Nation" has a good take on this. See Being Wrong, With The Nationals' Pitching Coach
Baseball Think Factory has an interesting discussion on this. See Nationals pitching coach Steve McCatty believes fewer K’s equals more W’s, and so far so good
Friday, July 6, 2012
Team OPS Differentials So Far In 2012
We are just about at the half way mark. The table below shows all teams. Their expected winning pct is from my equation .5 + 1.26*OPSDIFF
Tango uses 1.8*OBP + SLG to approximate sOBA. Here are the differntials for that
Wednesday, July 4, 2012
Career Leaders In Game Ending Homers
This was posted to SABR-L on June 24 by David Vincent.
Jim Thome 13
Babe Ruth 12
Jimmie Foxx 12
Stan Musial 12
Mickey Mantle 12
Frank Robinson 12
Tony Perez 11
Dick Allen 10
Reggie Jackson 10
Mike Schmidt 10
Harold Baines 10
Barry Bonds 10
Sammy Sosa 10
David Ortiz 10
Albert Pujols 10
Jim Thome 13
Babe Ruth 12
Jimmie Foxx 12
Stan Musial 12
Mickey Mantle 12
Frank Robinson 12
Tony Perez 11
Dick Allen 10
Reggie Jackson 10
Mike Schmidt 10
Harold Baines 10
Barry Bonds 10
Sammy Sosa 10
David Ortiz 10
Albert Pujols 10
Subscribe to:
Posts (Atom)