His career record against them was 28-13. From 1955-61, it was 27-10 with a 3.06 ERA while his ERA against everyone else was 3.42. But did he really pitch better or differently against the Yankees?
Let's start with strikeout-to-walk ratio. In those years, Lary's was 1.62 against non-Yankee teams (I included HBP and took out IBBs-all data from Retrosheet). Against NY, it was 1.71. That may seem consistent with the "Yankee Killer" nick name, but over those years the Yankees themselves had a 1.43 ratio while the rest of the league had 1.32. So the typical pitcher had a strikeout-to-walk ratio that was .11 higher against the Yanks than everyone else. Lary was .09 better. So he was doing just about what other pitchers did.
Now HRs or HR rate (I use HRs divided by PAs with IBBs taken out). Lary allowed the Yanks a 2.6988% while he allowed the rest of the league 1.75%. So the Yanks did about 0.948 percentage points better against Lary than the average team from the rest of the AL. But that is just about normal. Over these years, the Yankees had a rate of 3.0097% while the rest of the league had a rate of 2.162%. The Yankees were about 0.848 percentage points better than the league average. So again, Lary's relative performance vs. NY is about what it was for other pitchers.
What about other hits? Lary's non-HR hit% against NY was .199 while against other teams it was .217. So that is a fairly big improvement. Some how he was better at preventing hits against the Yankees than he was against other teams. The Yankees themselves had a .205 rate while the rest of the league had .204. So the typical pitcher allowed more hits (but not alot more) to the Yankees than they normally did.
So it seems like the one thing that Lary was good at when he faced the Yankees was in preventing them from getting singles, doubles and triples. But the difference was only .018. Over, say, 36 PAs per game, that is just .648 hits. The run value of those hits is about .55 (the weighted average of the linear weights values that Pete Palmer established). So that makes a run value of .36 (interesting that that is just about the difference between his ERA against other teams and the one he had against the Yankees, 3.42 vs. 3.06).
The Tigers did score 4.93 runs per game in his starts against the Yankees from 1955-61. They averaged 4.61 runs per game overall. So the hitters rose to the occassion to support him. And maybe the fielders played a role in lowering the rate of non-HR hits he allowed. So it is possible that Lary became the "Yankee Killer" due to the aid of his teammates.
Thursday, December 30, 2010
Wednesday, December 22, 2010
Bert Blyleven vs. Jack Morris
It seems like people who favor Morris over Blyleven say Morris was better in the clutch or better in big games. So I try to look at those issues here.
The table below shows their stats in 3 situations: runners on base (ROB), runners in scoring position (RISP), and close and late (CL). Data from Retrosheet.

I did not try to adjust these numbers for the league average. Blyleven might get a slight edge since the early 70s were not a big hitting era. But much of their careers did overlap. The only place where either pitcher has a big edge is Morris's edge in AVG in CL situations. But that .021 does not add up to alot. Blyleven had 2,129 ABs faced in those cases. That amounts to about 44 hits or 2 per season. That seems pretty small.
The next table shows their post season stats. League Championship Series and World Series are combined.

Morris has just about twice the IP. So if you doubled Blyleven's stats, you can see that there is not much difference between the two. Blyleven would have 86 hits, just about what Morris has. Same for HRs. But he would have more strikeouts and fewer walks.
I also looked at how they did in September pennant races. If a team finished 10 or more games ahead or behind, it was not considered to be a pennant race. If a team finished less than 10 games ahead or behind and if they were 5 or fewer games ahead or behind at the end of play of Aug. 31, it was considered a pennant race. 1991 for the Twins was not considered a pennant race (Morris was on that team). They began Sept. 7 games ahead (GA). On Sept. 15 they were 7.5 GA and they finished the season 8 GA. 1981 was not included since it was a strike year with a split season. Many teams were within a few games in Sept. This is highly unusual and winning the 2nd half only gave you a chance to play for the divisional title.
So the years I have for Morris as Sept. pennant races are 83, 87, 88, 92, 93. For Blyleven they were 77-80, 87, 89. Each pitcher had a total of 231.66 IP (Oct. data was included). Some of this data might inlcude games pitched after the divisional title was decided. But I did not feel like spending the time to figure that out. The table below shows how each pitcher did in these cases.

Again, it does not look like there is much difference between the two. So given Blyleven's far superior career stats (and peak value as measured by stats like WAR), he still deserves to make the Hall of Fame ahead of Morris. Whatever edge in the clutch or big games Morris might have, it is definitely not enough to put him ahead of Blyleven.
Wednesday, December 15, 2010
A Crude Measure Of The Most "All-Around" Players Since 1957
I started thinking about this when Cooper Nielson in a Baseball Think Factory discussion said:
See Cooperstowners in Canada: Larry Walker should be the second Canadian player elected to Cooperstown.
So here is how the crude measure works:
Multiply Gold Glove awards times 30. The idea here was to scale a great player in this stat to a great player in HRs or SBs. Brooks Robinson had the most GGs among position players with 16 and 16*30 = 480, close to 500.
Divide non-HR hits by 5. If a player had 2500 non-HR hits, you get 500.
Multiply SB*HR*non-HR*GG (with the above mentioned adjustments being made for GG and non-HR). If player had no GGs, I stopped multiplying so they did not end up at zero.
For Willie Mays it was 42,129,996,480. That is way too high a number to work with. So I raised it to the .25 power. That gave him 453, a more familiar kind of number to baseball fans. But that was divided by PAs and then multiplied by 10 to get the final number. Mays then had .363 (a nice number, close to the highest all-time batting average of .366 belonging to Ty Cobb). Here is the top 25:
1 Willie Mays 0.363
2 Torii Hunter 0.362
3 Barry Bonds 0.357
4 Larry Walker 0.355
5 Ichiro Suzuki 0.352
6 Ryne Sandberg 0.349
7 Eric Davis 0.345
8 Cesar Cedeno 0.345
9 Roberto Alomar 0.337
10 Devon White 0.333
11 Andruw Jones 0.330
12 Andre Dawson 0.327
13 Garry Maddox 0.325
14 Bobby Bonds 0.316
15 Andy Van Slyke 0.313
16 Mike Schmidt 0.311
17 Ken Griffey Jr. 0.309
18 Carlos Beltran 0.302
19 Paul Blair 0.296
20 Joe Morgan 0.295
21 Marquis Grissom 0.293
22 Ivan Rodriguez 0.292
23 Dwayne Murphy 0.291
24 Bill White 0.285
25 Jimmy Rollins 0.284
If I started with his stats from 1957 on, when they started giving out Gold Gloves, Mays gets .378.
"I suppose the "best all-around player" argument could go like this (keep in mind this is not my argument and not one I even agree with, but one that could conceivably and logically put Walker #1 in his era): There are five traditional baseball tools: hitting (for average), hitting for power, running, playing defense, and throwing."
See Cooperstowners in Canada: Larry Walker should be the second Canadian player elected to Cooperstown.
So here is how the crude measure works:
Multiply Gold Glove awards times 30. The idea here was to scale a great player in this stat to a great player in HRs or SBs. Brooks Robinson had the most GGs among position players with 16 and 16*30 = 480, close to 500.
Divide non-HR hits by 5. If a player had 2500 non-HR hits, you get 500.
Multiply SB*HR*non-HR*GG (with the above mentioned adjustments being made for GG and non-HR). If player had no GGs, I stopped multiplying so they did not end up at zero.
For Willie Mays it was 42,129,996,480. That is way too high a number to work with. So I raised it to the .25 power. That gave him 453, a more familiar kind of number to baseball fans. But that was divided by PAs and then multiplied by 10 to get the final number. Mays then had .363 (a nice number, close to the highest all-time batting average of .366 belonging to Ty Cobb). Here is the top 25:
1 Willie Mays 0.363
2 Torii Hunter 0.362
3 Barry Bonds 0.357
4 Larry Walker 0.355
5 Ichiro Suzuki 0.352
6 Ryne Sandberg 0.349
7 Eric Davis 0.345
8 Cesar Cedeno 0.345
9 Roberto Alomar 0.337
10 Devon White 0.333
11 Andruw Jones 0.330
12 Andre Dawson 0.327
13 Garry Maddox 0.325
14 Bobby Bonds 0.316
15 Andy Van Slyke 0.313
16 Mike Schmidt 0.311
17 Ken Griffey Jr. 0.309
18 Carlos Beltran 0.302
19 Paul Blair 0.296
20 Joe Morgan 0.295
21 Marquis Grissom 0.293
22 Ivan Rodriguez 0.292
23 Dwayne Murphy 0.291
24 Bill White 0.285
25 Jimmy Rollins 0.284
If I started with his stats from 1957 on, when they started giving out Gold Gloves, Mays gets .378.
Sunday, December 12, 2010
What Might Explain Ron Santo's Low Hall Of Fame Voting Percentages?
It seems like it might be for the reasons I have have seen people give the last week or so: no post-season exposure, somewhat short career (he did not reach 10,000 PAs), lack of milestones like 3000 hits or 500 HRs and lack of MVP awards.
Last year and earlier this year I posted some regression generated equations that tried to explain the percentage of the Hall of Fame vote player got in their first year of eligibility (and also their highest percentage). The model I came up with was based on some trial and error. That seemed unavoidable, since it is hard to have priors on what exactly the voters are thinking. The model looked at all players that became eligible for the first time from 1980-2009.
The model uses the following data to explain vote percentage:
Reaching 10,000 PAs
500 HRs
3000 hits
500 SBs
Gold Gloves
All-Star games
World Series performance
MVP awards
Gold Gloves and All-Star games got capped at certain levels which were then squared. The idea was that those things have an exponential effect which tapers off. There were also interaction terms for World Series performance, Gold Gloves and All-Star games. The idea there was that getting lots of Gold Gloves and playing in lots of All-Star games has more than an additive effect (after I discuss what the model predicted for Santo, technical details like regression results and variable descriptons will be covered).
Santo's first year percentage was 3.9%. Normally, he would no longer be eligible in the writers' voting. But he and some other players were re-instated in 1985. He got 13.4%. The model predicted that he would get 17.65%. The standard error was .08. So even if we give him 8% more, that only jumps him up to 21.4%. Still a pretty low total for a first year (Billy Williams got 23.4% in his first year in 1982 and steadily increased until he got 85.7% in 1987).
Santo's highest percentage was 43%. The model predicted it would be 30%. So he actually did better than that. The standard error was .117. So he was predicted to be about 4 standard errors below what is needed for induction, 75%. And his actual highest percentage was still about 3 standard errors below 75%. Billy Williams highest predicted percentage was 29.6% while it was actually 85.7%. That differential of 56.1% is the highest positive differential. Why Williams is in and Santo isn't is an interesting question.
Here was the equation where the player's first year vote percentage was the dependent variable
PCT = -.010 + .00086(WSAS) + .048(GGAS) + .070(MVP) + .404(3000 HIT) + .280(500 HR) + .002(ASSQ10) - .00089(GGSQ7) + .071(500SB) - .006(WSIMPSQ50) + .100(10000PA)
The adjusted r-squared was .898 The standard error was .08.
Here was the equation where the player's highest vote percentage was the dependent variable
PCT = -.014 + .00037(WSAS/1000) + .025(GGAS/1000) + .067(MVP) + .257(3000 HIT) + .201(500 HR) + .0048(ASSQ10) - .0013(GGSQ7) + .071(500SB) - .00167(WSIMPSQ50/1000) + .137(10000PA)
The adjusted r-squared was .861 The standard error was .117.
MVP is number of MVP awards won, 3000H is a dummy variable (1 if a player reached it, 0 otherwise). The 500HR is also a dummy variable as it is for 500SB and 10000PA (if you made it to 10,000 career plate appearances, you get a 1, 0 otherwise). I used all the voting data from 1990-2009.
What is ASSQ10? It is the square of the number of All-star games played in squared. But AS games played is maxed out at 10. The assumption here is that being an all-star has a positive exponential effect but only up to a point where no more games helps (I have a graph below to help explain this). The GGSQ7 is the same thing for Gold Gloves.
WSIMPSQ50 involves World Series play. First, WSIMP is World Series PAs times OPS. The idea here that the more you play in the World Series the more votes you would get, but by multiplying it by OPS, it also includes how well you played (or just hit). This gets maxed out at 50 and is squared, for the same reason as all-star games (yes, Reggie Jackson is first here and way ahead of everyone else at 141, with Dave Justice and Lonnie Smith tied for 2nd at 101).
The last two variables are interaction variables. GGAS is the gold glove variable multiplied by the all-star variable and WSAS is the world series variable times the all-star game variable. It looks strange that the coefficient values on GGSQ7 and WSIMPSQ50 are negative. But you might notice that they are positive on the interactive variables. I think this is like when a regression uses both X and X-squared in a regression if the phenomena is non-linear (an inverted parabola, for example). The coefficient on X ends up being positive while the x-squared coefficient is negative. The reason I put in these interactive variables was to see if players who were strong in both got an extra boost, as if there was some synergy going on. It seems like they did get an extra boost.
Since the dependent variable can only go from 0 to 100, the coefficient would be very low. So I divided these three variables by 1000 (my stat package was showing coefficient values of .00000 before I did this).
Monday, December 6, 2010
Did Santo Play In An Era Of Poor Third Basemen?
Here are the offensive winning percentages for NL 3B men for different periods. Data from the Lee Sinins Complete baseball encyclopedia.
1941-50) .507
1951-60) .495
1961-70) .516
1971-80) .512
1981-90) .498
Santo had .618 from 1961-70. He was about 9% of the total, so without him it was probably about .506. Nothing unusual. The guys Santo got compared to were not sub par in hitting.
Santo lead the NL 4 straight years in Total Zone Runs (fielding) for 3rd basemen (from Baseball Reference). But his total over those 4 years, 39, is one of the lowest (BR starts this stat in the early 1950s-I calculated the cumulative total of the leaders over each 4 year period regardless of who it was). It is tied for the 7th lowest in the NL. The lowest is 35 and some of the periods that were lower include the 1981 strike year. The average cumulative 4 year total for the leaders was about 55 in the NL and 72 in the AL. Only two periods in the AL were below 40.
So it is possible that in some years Santo benefits by being compared to poor fielding 3rd basemen. But this is probably not alot of his overall value.
See Yearly League Leaders & Records for Total Zone Runs as 3B at BR. Santo's numbers from 1965-8, the years he lead, seem low compared to the AL in those years and the NL in the years both before and after.
Sunday, December 5, 2010
Santo Was Valuable Outside Of Wrigley Field
Santo did seem to benefit alot from Wrigley. But what if we tried to estimate only his value in road games? Doing a quick calculation to find his road OBP & SLG from 1960-73, I got .346 & .413. Does not sound that great. But in his time, it was pretty valuable. Here is the relationship from regression analysis between runs per game and OBP & SLG:
R/G =16.55*OBP + 10.56*SLG - 5.15
A team with an OBP of .342 and an SLG of .413 would score 4.93 R/G. The league average in those years was about 4.06. That would give us a Pythagorean pct of .596. Pretty darn good.
I also ran a regression with winning pct being the dependent variable and runs per game and opponents runs per game being the independent variables. Here is the equation
Pct = .515 + .111*RG - .114*ORG
If a team scored 4.93 runs per game and allowed 4.06 per game, they would have a .596 pct. That is how good Santo was just in road games.
Friday, November 26, 2010
Lefty Grove's Peak Vs. Sandy Koufax's Peak
I used a 5-year period for each guy. For Grove, it was 1928-32. For Koufax, it was 1962-66. The table below has some comparisons:

RSAA means "runs saved above average." It comes from Lee Sinins' Complete Baseball Encyclopedia. The numbers are park adjusted. So Grove has a big lead here, both in total and per 9 IP. I will come back to these numbers later when I plug them into the Pythagorean formula.
Grove was 60% better than average at preventing HRs (that is what the 160 means). He gave up 49 HRs while the average pitcher would have allowed 78 (100*(78/49) is about 160). This gives him a pretty big edge over Koufax. But they are not park adjusted. If they were, Grove would have an even bigger edge. Here are the HR park factors for the Philadelphia A's from 1928-32 from the STATS, Inc. All-Time Baseball Sourcebook: 126, 165, 153, 104, 199 (the 126 means that Shibe gave up 26% more HRs than the average park). Now Shibe Park may have had some asymmetries, so that lefties hit alot more HRs. With Grove more likely to face righties (being a lefty himself), it is possible the park did not hurt him as much as these factors suggest. But A's righties Foxx, Miller and Dykes generally had much higher slugging percentages at home than on the road (from Retrosheet). So my guess is that Grove certainly was not aided by his park in preventing HRs.
Koufax allowed 89 HRs while the league average was 124 and had the following HR park factors in his years: 50, 63, 62, 49, 70 (meaning Dodger Stadium allowed fewer HRs than average). So he was helped quite a bit yet Grove still has the big edge here. He allowed 89 HRs while the league average was 124.
Relative SO/BB is each pitcher's strikeout-to-walk ratio divided by the league average. Grove had a 2.67 strikeout-to-walk ratio while the league average was 0.95. The 2.67/0.95 is multiplied by 100 to get 281. That beats the 225 of Koufax or 100*(4.57/2.03).
The ERA+ comes from Baseball Reference. It is ERA relative to the league average but also adjusted for park effects. Grove only has a slight edge here.
WAR comes from Baseball Reference (and they get it from Sean Smith at Baseball Projections). It is "Wins Above Replacement for Pitchers. A single number that presents the number of wins the player added to the team above what a replacement player (think AAA or AAAA) would add. This value includes defensive support and includes additional value for high leverage situations."
It is not clear to me how Koufax beats Grove here. Grove has alot more RAR or "runs above replacement." It might have something to do with the leverage adjustments. None are made for Grove since the play-by-play data has not been posted at Retrosheet. The WAR and RAR numbers imply that for Grove's years, it took 11 extra runs to win a game (441/40.1 = 11) and only 8.26 for Koufax (347/42).
Baseball Projections says that it normally takes about 10 extra runs to get a win. I wonder if they are using the formula which says it takes 10 times the square root of the number of runs scored per inning by both teams. For Grove's years I calculated that to be 10.7 and for Koufax got 9.54. That would give Grove a WAR of 41.21 (441/10.7) and Koufax 36.37 (347/9.54).
Pitching Runs is "Adjusted Pitching Runs." It comes from Baseball Reference. It is "A set of formulas developed by Gary Gillette, Pete Palmer and others that estimates a pitcher’s total contributions to a team’s runs total via linear weights." Lee Sinins told me it might also be based on decisions, but I am not really sure. Anyway, Grove has a big lead here, too.
Now to come back to RSAA and try to calculate the Pythagorean pct for each guy using RSAA per 9 IP. The AL of 1928-32 averaged 5.12 runs per game (yearly averages weighted by Grove's IP) and 5.12 - 1.98 = 3.14. So if Grove allows 3.14 while his team scored 5.12, he would have a winning pct of .727. Koufax would allow 2.78 while his team would score 4.05 runs per game. That gives him a pct of .679.
One thing I have not mentioned yet or tried to take into account is integration. Last January, I compared Grove's career to Randy Johnson's. See How Might Integration Have Affected The Lefty Grove/Randy Johnson Debate? I tried to estimate how much better the hitters would have been during Grove's time if the percentage of players who were non-white was about the same as during Johnson's. I also tried to adjust for the number of non-white pitchers and non-white fielders. I came up with Grove's ERA going up about 10%. What if I did that here?
Then Grove would allow 3.45 runs per game and his pct would fall to .688. That is still higher than Koufax.
But if we use the adjusted pitching runs, Grove allows 3.32 runs per game (5.12 - 1.8). He would have a pct of .704. Koufax would allow 2.63 runs per game (4.05 - 1.42). He would have a pct of .703. That would make the two about even. Grove would get the edge due to more IP.
But if we raise Grove's runs per game by 10%, to 3.65, his pct would be only .663. That would put Koufax ahead.
Finally, if we knock down Grove's ERA+ from Baseball Reference of 172 by 10%, he would be at 155, below Koufax's 167. The 10% adjustment for integration is just an estimate. It is the same one I used when comparing Grove to Johnson. The % of players and pitchers who were non-whites during Koufax's time was probably lower than during Johnson's time. So adding 10% to Grove's ERA is probably too much. I don't think I know the right adjustment to make. But this gives us some idea of what the effect of integration might be.
If I lowered Grove's strikeouts per 9 IP by 10% from 5.91 to 5.32 and raised his walks per 9 IP from 2.21 to 2.43, his new strikeout-to-walk ratio would be 2.19. That divided by 0.95 would be 2.30. So his relative SO/BB would be 230, still higher than Koufax's 225.
If I raised Grove's HRs by 10%, he would have allowed 54 HRs. Then 78/54 = 1.45. That times 100 is 145. That is still higher than Koufax's relative HR rate of 139.
Sunday, November 21, 2010
Indispensable Seasons Go To WAR! (Or Did Willie Mays Have The Greatest Season Since 1950 in 1962?)
If you are still reading, thanks. I will try to explain.
Suppose a team comes in 1st place, finishing 1 game ahead of the 2nd place team. John Smith had a WAR (wins above a replacement player) of 6. Then is "INDWAR" would be 5 or 6 - 1. His team needed 5 of his WAR to get them into at least a tie for first.
My first post on this was The most indispensable seasons. In that case, instead of using WAR, I used what Pete Palmer calls "Total Player Rating" or TPR (more recently it has been called "Batting + Fielding Wins" or BFW). Here I used WAR from Baseball Reference to find the most indispensable seasons since 1900.
The table below shows the top 25.

When you see a "0" in the games ahead column, it means that player's team tied for first place with another team. Then they had a playoff. Their season's WAR included what they did in the playoff game(s). I tried to estimate their WAR from any playoff games. Probably the most anyone got was about .4 by Boudreau in the one game (he went 4-for-4 with 2 HRs). Some cases are teams that were wild cards, like the 2002 Giants. So they would have been so many games ahead of the next best team. Some 1st place teams in the wild card era were either compared to the 2nd place team in their division if that team was not the wild card or the team that finished 2nd in the wild card if their division's 2nd place team was the wild card.
It probably does not surprise anyone that Yaz is first. But Willie Mays 1962 is not far behind. Guidry 1978 is the highest pitcher. But he probably got a very small amount of WAR in the playoff game (he pitched well but not great). The 1980 Phillies needed great years from both Schmidt and Carlton just to eke out a 1 game victory.
Many of the players are Hall of Famers. Ruth also has the 37th best season in 1916, as a pitcher!
I wondered how well some of these guys did in the clutch that year. So I looked at the top 10 since 1950 when Retrosheet has stats like hitting with Runners in Scoring Position (RISP) and in Close and Late Situations (CL). The table below shows how well the top 10 hit in all situations.

Now with Runners on Base (ROB)

Now with RISP

Now Close and Late.

Now Sept/Oct

If you examine those numbers closely, you will see that the only player to have a higher AVG, OBP, and SLG in all the "clutch" cases than he did in Total was Mays. Click here to see all of these stats grouped by player. It might be easier to see that only Mays did better in all the clutch situations.
In fact, Willie Mays was the best of the ten in Tom Tango's clutch rating, which involves WPA or Win Probability Added. All plate appearances are rated for how much they affect the outcome based on score, inning, etc. Here is the definition from the Fangraphs cite:
"Clutch: A measurement of how much better or worse a player does in high leverage situations than he would have done in a context neutral environment."
Here is how well the top ten did:
Willie Mays 1.4
Jackie Robinson 0.5
Hank Aaron 0.3
Adrian Beltre 0.1
Alex Rodriguez -0.1
Mike Schmidt -0.3
Barry Bonds(98) -0.5
Robin Yount -0.8
Carl Yastrzemski -1.1
Barry Bonds(02) -1.3
This means that Mays' extra good hitting in high leverage situations added 1.4 wins. Seeing as how the Giants finished in a tie with the Dodgers in 1962, that is very important. Mays did well in the 3-game playoff series, too. In game 1, he went 3-for-3 with 2 HRs and a walk. One HR was off of Koufax, in the first inning with one on to get the scoring started. Giants won 8-0. In game 2, he was 1-for-5 and the Dodgers won 8-7. In game 3, he was 1-for-3 with 2 BBs. Giants won 6-4, getting 4 runs in the top of the 9th. Mays singled in a run in that rally and scored another.
When it was all said and done, a great player had to have one of his greatest seasons just to get his team into a playoff. Mays had to hit much better than usual in the clutch and come through in the playoff. What could be a more fantastic year than that?
Thursday, November 18, 2010
Rick Reuschel for the Hall of Fame (Revisited)
See my first post Rick Reuschel for the Hall of Fame .
Here is a brief summary (skipping the more advanced stats I used):
-His strike-out-to-walk ratio was 31% better than the league average
-He gave up 21.6% fewer HRs than average (pitching mainly in Wrigley Field!)
I am doing this again because when I looked at Halladay and the Cy Young award, I noticed that Reuschel is 30th in career Wins Above Replacement (WAR) among pitchers at Baseball Reference. His WAR is 66.3. That seems like a high enough rank in terms of career value. The Hall should have room for 30 pitchers. He had good longevity, pitching over 3500 innings in 19 seasons.
The only pitchers ahead of him in career WAR not in the Hall are: Clemens, Maddux, Randy Johnson, Bert Blyleven, Pedro Martinez, Mussina, Schilling and Glavine. Most, if not all, of them will make it. I counted about 26 Hall of Famers behind him, just in the top 100. He is ahead of Jim Palmer, Juan Marichal, Whitey Ford, Don Drysdale, Jim Bunning, just to name a few.
He had a pretty decent peak value, too. He was in the top 5 among NL pitchers in WAR each year from 1977-80 (1-5-3-4). He also had two other top 5 finishes in his career. He was the 2nd best pitcher in the NL over the 1977-80 period, according to WAR. Here is the top 10:
Phil Niekro 27.6
Rick Reuschel 24.8
Steve Carlton 20.6
Steve Rogers 19.3
J.R. Richard 18.1
Tom Seaver 17.4
Burt Hooton 16
Bruce Sutter 15.6
John Candelaria 15.3
Don Sutton 13.7
He beats Carlton, who had 2 Cy Young awards in those years.
Tuesday, November 16, 2010
Halladay And The Cy Young Award
It was unanimous. That seems a little surprising. No doubt among the voters. Here are the NL leaders in WAR for pitchers according to Baseball Reference:
1. Jimenez (COL) 7.1
2. Halladay (PHI) 6.9
3. Johnson (FLA) 6.4
Seems like these other two guys could have gotten some first place votes.
Halladay is the one of only 4 pitchers since 1980 to have 3 or more straight seasons with a strikeout-to-walk ratio greater than 5 while qualifying for the ERA title. The others are Maddux (4), Schilling (4) and Wells (3). Data from the Lee Sinins Complete Baseball Encyclopedia.
Halladay is one of only 6 pitchers since 1980 to have 3 or more straight seasons with an ERA less than 2.80 while qualifying for the ERA title. The others are Maddux (7), Rijo (4), Johnson (4), Clemens (3) and Brown (3).
Halladay has the most WAR over the last three years, 20.2. The last pitcher to have 20+ WAR over three years was Santana, 2004-6. Here is the top ten from 2008-10:
Roy Halladay 20.2
CC Sabathia 16.8
Tim Lincecum 16.7
Cliff Lee 16.6
Felix Hernandez 16.3
Jon Lester 16.2
John Danks 16.1
Zack Greinke 15.6
Ubaldo Jimenez 15.3
Johan Santana 14.4
Halladay now ranks 10th in Cy Young Award Voting Shares. Besides his two wins, he has four other top 5 finishes. He joins Gaylord Perry, Roger Clemens, Pedro Martinez and Randy Johnson as the only pitchers to win the award in both leagues. Here is the top 10 in award shares:
Randy Johnson (5 wins) 6.5
Greg Maddux (4 wins) 4.92
Steve Carlton* (4 wins) 4.29
Pedro Martinez (3 wins) 4.26
Tom Seaver* (3 wins) 3.85
Jim Palmer* (3 wins) 3.57
Tom Glavine (2 wins) 3.15
Sandy Koufax* (3 wins) 3.05
Roy Halladay (2 wins) 2.91
*Hall of Famer
Halladay has finished first in WAR 2 times and has 5 second place finishes. His career WAR is no 54.3. That is 62nd best ever. In a year or two he will be in the top 40. Maybe he will end his career in the top 25.
Friday, November 12, 2010
Players Who Won The Triple Crown Over A Two-Year Period Since 1920
I got started on this because I wanted to see if Albert Pujols did it for the last two years. He just missed. More on that later. I set the plate appearance (PA) minimum at 800. The tables below show the winners. Data came from the Baseball Reference Play Index.
What is interesting to me is that in some cases, the winners were far ahead of the other players in all three stats, that Al Rosen was the only guy to do it twice in a row, and that Albert Belle is the only guy to do it since 1954. Rosen was probably only able to do it because Ted Williams was in the Korean War. And Williams is the only other guy to do it twice.


Now back to Pujols. The table below shows the leaders over the 2009-2010 seasons with a 1,000 PA minimum. He's just a bit beind Votto and Ramirez in batting average (BA). I hate it when mere mortals get in the way. May the Gods show them no mercy.

Then I thought "what about a 3-year triple crown for Pujols?" No luck there either, since Ryan Howard beats him out in RBIs. This is the next table. 1500 PA minimum.

Not having the RBI lead is certainly not Pujols' fault. The next two tables show how both he and Howard hit with Men On and with Runners in Scoring Position (RISP). Pujols ends up walking alot more in those cases. In all cases, Pujols walks 13.5% of the time while it is 12.4% for Howard. But with Men On, Pujols' walk rate is about 21% while Howard has 12%. With RISP, those numbers are about 29% & 16%. So, even though Pujols hits alot better with Men On and with RISP, as you can see below, he ended up with fewer RBIs.


But Pujols gets the last laugh. He has won the 10-year triple crown, with a 2,000 PA minimum. This is the last table.

Friday, November 5, 2010
The Weather Was Nice For The World Series But How Was It In Some Other Major League Cities?
I have wondered what things would have been like if the Twins had made it to the World Series. Imagine night games, outside, in Minnesota, in the last week of October and the first week of November. So while I watched the series, I checked the temperatures in various cites using Accu Weather. The data I collected can be seen at World Series Weather 2010.
The first column gives the temperature and the second column says "wind ch" for wind chill. I think that is what Accu Weather means by real feel. I also recored the local time (they were all PM, inspite of my typos). In the last column I mention any description that Accu Weather gave, like showers if it was raining at that time or if showers were on the way. In some cases they said something about wind gusts. On Nov. 1 at 7:11 pm, it was 47 degrees in Minneapolis with wind gusts over 40 MPH. That would have made for a fun game as the night went on (I don't know why Accu Weather showed a "real feel" of 46 degrees with such strong winds-I also don't know why the real feel was sometimes higher than the stated temperature).
There were some low temps out there but probably not anything we have not seen in recent years. October 28 in Cleveland had a temp of 43, wind chil of 30 and showers. That would have been no fun to play in. So it seems that no city realized my worst fear of sub-freezing weather and snow when a game was supposed to be played.
Sunday, October 31, 2010
Have The Rangers And Giants Discovered A New (Old) Way To Win?
That is what a recent Wall Street Journal article says. See Hitting Baseballs, Just Not as Far: Giants and Rangers Win With Contact Hitting, Bunts and Baserunning; the 'Lost Arts'. But I don't think that they are doing anything so different from other teams that it helps them score extra runs. Here is an excerpt:
Both teams, however, are actually scoring just about the number of runs you would expect based on their OBP and SLG. From 2007-2009, the relationship between runs per game and those stats in MLB was:
R/G = 16.04*OBP + 11.595*SLG - 5.52
The Rangers had an OBP & SLG of .338 & .419. The equation predicts they would score 4.76 runs per game while it actually was 4.86. So just about what you would expect, meaning all those sacrifices and SBs are not making much difference.
The Giants had an OBP & SLG of .321 & .408, projecting to 4.36 runs per game while it was actually 4.3. Just like the Rangers, all these "small ball" strategies are not making much difference. (the equation comes from a linear regression analysis of all 90 teams from 2007-09-the r-squared was .904 and the standard error of the regression was .137 runs per game).
Another regression, based on all teams from 1989-2002, shows the relationship between team winning pct and OPS differential. Here it is:
Pct = .5 + 1.25*OPSDIFF
The Rangers hitters had an OPS (OBP + SLG) this year of .757 while they allowed an OPS of .709. The Giants had .729 & .683. So the two team's differentials, respectively, were .048 & .046. The numbers below show each team's predicted pct, and predicted wins, followed by their actual wins in parantheses:
Rangers) .560-90.72 (90)
Giants) .558-90.32 (92)
Each team won just about the number of games expected (each within two of the prediction). There are no extra wins due to using "lost arts." In fact, they have done well by some combination of hitting for power and getting on base and generally preventing their opponents from doing so. This is a time honored way of winning, as Branch Rickey explained back in 1954. I posted something about that earlier this year. See Scouts vs. Statheads: What Might Branch Rickey Say?.
"San Francisco was 17th in runs scored and 13th in slugging percentage this season. But they ranked fifth in strikeouts and third in sacrifice bunts in the National League and fourth in all of baseball in sacrifice hits.
Texas was only ninth in slugging percentage, but the team had the most sacrifice bunts in the American League, the second-most sacrifice flies and the fourth fewest strikeouts. The Rangers were also seventh in the majors in stolen bases."
Both teams, however, are actually scoring just about the number of runs you would expect based on their OBP and SLG. From 2007-2009, the relationship between runs per game and those stats in MLB was:
R/G = 16.04*OBP + 11.595*SLG - 5.52
The Rangers had an OBP & SLG of .338 & .419. The equation predicts they would score 4.76 runs per game while it actually was 4.86. So just about what you would expect, meaning all those sacrifices and SBs are not making much difference.
The Giants had an OBP & SLG of .321 & .408, projecting to 4.36 runs per game while it was actually 4.3. Just like the Rangers, all these "small ball" strategies are not making much difference. (the equation comes from a linear regression analysis of all 90 teams from 2007-09-the r-squared was .904 and the standard error of the regression was .137 runs per game).
Another regression, based on all teams from 1989-2002, shows the relationship between team winning pct and OPS differential. Here it is:
Pct = .5 + 1.25*OPSDIFF
The Rangers hitters had an OPS (OBP + SLG) this year of .757 while they allowed an OPS of .709. The Giants had .729 & .683. So the two team's differentials, respectively, were .048 & .046. The numbers below show each team's predicted pct, and predicted wins, followed by their actual wins in parantheses:
Rangers) .560-90.72 (90)
Giants) .558-90.32 (92)
Each team won just about the number of games expected (each within two of the prediction). There are no extra wins due to using "lost arts." In fact, they have done well by some combination of hitting for power and getting on base and generally preventing their opponents from doing so. This is a time honored way of winning, as Branch Rickey explained back in 1954. I posted something about that earlier this year. See Scouts vs. Statheads: What Might Branch Rickey Say?.
Friday, October 29, 2010
Great ERAs as season ends
This is a guest post by Clem Comly and Tom Ruane, based on recent posts to SABR-L.
2010 Giamts ERA for Sept./Oct. regular season was 1.91. Cy Morong asked me off-list how unusual is a montly ERA that low.
So I asked baseball-reference.com's Play Index. Unfortunately, I couldn't specifically ask about the best team ERAs for calendar months.
So I changed the question (perhaps inspired by the Kobyashi Maru). I decided to look at ONLY September combined with October. Baseball-reference.com couldn't answer that question directly, but I asked it to round up the usual suspects That is, I asked for lowest OR of exactly 26 games for a team at the end of its season.
For those teams after 1919, I could manually look up the monthly splits for those teams on the Retrosheet site (and where necessary combine Sept. and October splits to calculate ERA for Sept./Oct.
It turns out the Giants finished with an extremely good but not record-setting autumn. Based on the results of the query, the odds are very good that the record holder for 1920-2010 is 1965 Dodgers at 1.50. I suspect if one worked through 1901-1919 a team from that era with easier unearned run rules and more errors would have the record. I include the 26-game stats (date range, game sequence number range, and OR in the span) below to indicate how much of the Sept./Oct. period the query covered. Also, the speed with which the OR zoomed up indicates the actual record holder is the 1965 Dodgers (a team that didn't make the list would have at least 65 OR in 26 games while '65 LA only had 47, only 72% of 65).

B.Retro means indicated season before the first season chronologically that Retrosheet has monthly splits. Retrosheet has splits for 1920-2009. 2010 data from baseball-reference.com.
Here is what Tom Ruane came up with after Clem raised the issue

[Editor's note: I added the relative ERA figures and they are not necessarily the 10 lowest ever, but all of them are probably near the top. The NL ERA in Sept/Oct this year was 3.72. That gives the Giants a relative ERA of .513, which looks very good by historical standards]
Clem Comly is the vice-president of Retrosheet and co-chair of SABR's statistical analysis committee while being a member of several other committees. He is also a Phillies fan.
Tom Ruane, a computer programmer in Poughkeepsie, N.Y., is a member of Retrosheet's board of directors. He has published articles in "The Baseball Research Journal" and "By The Numbers." He won SABR's highest honor, the Bob Davids Award, in 2009.
Tuesday, October 26, 2010
Neither Giants Nor Rangers Have Clear Edge According To OBP, SLG
I rated each team using the formula 1.7*OBP + SLG. I did that for their opponents as well. Then I found their differential for the 1st half of the season, the 2nd, Sept/Oct and the post season (each series was weighted by the number of games). The table below has the results (clicking on it will enlarge it).
The Rangers were clearly the superior team in the 1st half, with a .064 differential vs. the Giants .038. But in the 2nd half the Giants pulled slightly ahead, .069 vs. .058. That is largely the result of incredibly great pitching. They held their opponents to a .297 OBP and a .373 SLG. But in Sept/Oct those numbers were .251 & .292 (their ERA was 1.91, over 29 games!). They almost kept it up in the playoffs, so far with .274 & .298.
In Sept/Oct, the Giants have a huge edge in the differential, .193 to .052. The Rangers have the big lead so far in the post season, .200 to .069. So no clear winner. It would have been nice if one team had a bigger differential in all cases. I think the Rangers will win, however, because I just don't see how any team can keep up the super human pitching the Giants have displayed. One other reason is that the Rangers have probably faced tougher competition, based on the fact that the AL once again won the majority of inter-league games.

Sunday, October 24, 2010
ALCS & NLCS Both End The Same Way
Both the ALCS and the NLCS ended on a called third strike to a batter who has at least one MVP award and one 50 HR season (AROD and Ryan Howard).
Saturday, October 23, 2010
Were The Rangers Actually Better Than The Yankees By The End Of The Season?
That is sort of the question raised by Rob Neyer at Rangers had 'em all the way. One comment caught my interest. It was from the peerless yet eccentric and reclusive "maxbentley." He said:

"For the season, the Yankees had an OPS differential of .065 while the Rangers had .048. In the 2nd half, those were .033 and .043. So the Rangers passed the Yanks. In Sept/Oct, those #'s were .009 & .035. The last month or so the Rangers were playing alot better. Could be the opponents. But it is interesting."I thought I would break things down just a little differently and use 1.7*OBP + SLG. The table below shows the results. As you can see, the Yankees were much better in the 1st half, but as the season wore on, the Rangers were clearly better. That could possibly be due to the Rangers getting Cliff Lee and getting more playing time from Moreland, as Neyer suggests. The Yankees differentials were .122, .042 and .017. The Rangers did a better job of maintaining their performance. Their differentials were .064, .058 and .052. It is true that the Yankees probably played a tougher schedule, especially the last 18 games. But even considering that, the Rangers seemed to have been a better team in the 2nd half and the last month. A .052-.017 edge the last month looks very big. Another thing occurs to me: Josh Hamilton only played 5 games in Sept./Oct. That held down the team OBP and SLG. So the Rangers might have been better than their differential indicates.

Tuesday, October 19, 2010
Simpsons Throw Alot Of Great Pitches In The "MoneyBart" Episode, But Its Not A Perfect Game
Spoiler Alert!
It was on about a week and a half ago, so most fans have seen it or heard about it. The episode was hysterical and I am not a Simpsons fan. Maybe it was too funny. The funny bits and one-liners came pretty fast. Bill James and Mike Scioscia are in it.
The premise is that Lisa takes over managing Bart's little league team. She then learns all she can about sabermetrics and decides to teach the players all she can about it. All team strategy and decisions from then on are made according to sabermetrics.
The team starts to climb out of the cellar and closes in on first place. But in a crucial game, Bart hits a home run (a grand slam, I think) to win it for the Isotots. But Lisa had ordered all the players to take pitches to wait for walks (because she learned how important OBP was). So she kicks Bart off the team.
But I think this ignores the fact that sabermetricians like power hitting (not as much as OBP, but we extol the virtues of SLG, too). I don't think there was anything in the episode up to that point that had said how many HRs he hit. Having him get kicked off the team paints a pretty black and white picture, with statsy tactics (taking pitches) only mattering while old-fashioned skills (like power) don't matter at all. That is not what sabermetrics says. In fact, all the great research has shown that HRs are the most valuable event (and people say we have not made a real contribution).
The other thing that was interesting that one of the books showed a page with a formula for OBP. When the video was paused, that page also showed a graph or chart that had the heading "OPS vs. RISP." I could see if it had been OPS vs. lefties or righties. Or even OPS with RISP. But that made no sense. Maybe they were just trying to see if geeks like me would catch it.
Wednesday, October 13, 2010
The Phillies Roy-Al Pitchers
We might consider both Halladay and Oswalt to be among the royalty in pitching. Some of the data I present below suggests that.
The first thing I did was to find all the pitchers through age 32 with 1500+ IP since 1900 and rank them by RSAA/IP (there were 445 pitchers). RSAA means "runs saved above average." It is from the Lee Sinins Complete Baseball Encyclopedia. It is also park adjusted. This is through 2009. The table below shows the top 10:

The next table simply shows total RSAA.

Then I found the leaders in pitching Wins Above Average (WAR) from Baseball Reference. Here are the leaders through age 33 including 2010:

I also constructed a crude fielding independent ERA. I ran a regression with these pitchers (through 2009) where their relative ERA depended on their relative HRs, SO, and BBs. Then I used that regression equation to predict their relative ERA (if I get a chance I will add the results-the r-squared was about .58). Here are the leaders:

So Walter Johnson had an ERA that was 69% better than the league average and he was 69% better at preventing HRs. He was predicted to have an ERA that was 48% better than average (but none of these numbers are park adjusted). Both Roys do well again.
Notice how they are alot better at preventing HRs and BBs than average but just slightly above average at striking out batters. That is similar to Maddux. In fact, I have created a HR/BB index for pitchers that Maddux did very well on. See Who Was More "Magical" Than Greg Maddux? (Or Pitcher's HR/BB/SO Rating).
I also created a WAR ranking using this crude fielding independent ERA. I divided IP by 9 to get games. Then adjusted every pitcher to a league average of 4 runs per game. That gave Walter Johnson an ERA of 2.74. Those numbers were used to calculate a predicted winning pct using Bill James' "Pythagorean formula." To compare that to a replacement level pitcher, I assumed that would be a .400 pct. So if a pitcher had 200 games and a predicted pct of .600, he would get 120 wins. The replacement would get 80. So the pitcher in question would have a WAR of 40.
The two Roys did not rank as highly as they did in the above tables, but they were still pretty good. Halladay was 50th and Oswalt was 68th. That still puts both in the top 15%. Walter Johnson had a predicted pct. of about .685 and a WAR of about 134 to lead all pitchers.
Saturday, October 9, 2010
Lincecum's Amazing Feet On Swinging Strikes
This is a guest post by Dave Smith, based on a message he sent to the SABR list. His research on this was mentioned in the Washington Post.
As most of you know, Tim Lincecum had a remarkable second inning last night in the first game of the NL Division Series. In the second inning, he struck out Alex Gonzalez, Matt Diaz, and Brooks Conrad, all on three swinging strikes. An NPR reporter contacted Lyle Spatz, chair of the SABR record committee this morning to ask about previous occurrences of such an event. Lyle referred him to me. Here is what I did and what I found:
I checked all games from 1988 through last night since this is the part of our data base with nearly complete pitch coverage (there are a small number of games without pitch data early in that period). I also looked at all Dodger games from 1947 through 1964, since we have pitch data for those games as well.
Lincecum is the second man to do this that I found in that sample, as follows:
Tim Lincecum, 10-07-2010, 14 total pitches (5 balls mixed in with the 9 swinging strikes)
Armando Benitez, 8-21-1999, 16 total pitches (7 balls mixed in with the 9 swinging strikes)
As an honorable mention, I found that Jeff Parrett of the Phillies struckout all three batters in one inning on 8-03-1989. He threw 13 pitches: 9 swinging strikes, 1 foul ball and 3 balls.
Dave Smith is president of Retrosheet. In 2005, he won SABR's highest honor, the Bob David's Award. He is also a professor of biology at the University of Delaware.
Thursday, October 7, 2010
And the 2010 Nobel Prize in physics goes to...
for his applied research demonstrating the properties of spherical objects, Roy Halladay!
Wednesday, October 6, 2010
Pitchers Who Had 30 Or More Quality Starts In A Season
This is a guest post by Clem Comly which was originally posted to SABR-L last week.
Felix Hernandez notched quality start #30 for the season yesterday. Mlb.com mentioned he was first to reach 30 since Randy Johnson in 2002. ESPN listed a handful who "recently" (since 1980?) reached 30. Using baseball-reference.com's play index, I was able to look at the period 1920-2010. Hernandez' 2010 season is the fifty-third 30+ QS season.
Looking at 1920-2010, the records for the sum of the QS games but excluding non-QS games and relief appearances:
Most QS: 37 1971 Wilbur Wood (21-10) (honorable mention 36 for 1946 Feller (26-9) and 1966 Koufax (27-6))
Most wins 28 1968 Denny McLain (28-3)
Most wins w/o loss 23 1980 Steve Stone in 24 QS
Most losses 13 1940 "Losing Pitcher" Mulcahy (12-13) and 1920 Rollie Naylor (6-13) [both pitching for a Phila. team]
Looking at just 30+QS seasons, the 1920-2010 records for the sum of the QS games but excluding non-QS games and relief appearances:
Best ERA 0.90 1922 Urban Shocker (19-10) in 30 QS
Worst ERA 2.09 1952 Robin Roberts in 31 QS
Best Winning% .960 1963 Koufax (24-1) in 31 QS
Worst Winning% .556 1972 Blyleven (15-12) in 31 QS
Most wins 28 1968 Denny McLain (28-3)
Fewest wins 13 2010 Felix Hernandez (perhaps 1 more start), 1920-2009 15 1965 Osteen, 1967 Bunning, and 1972 Blyleven.
Most losses 12 1972 Blyleven (15-12) in 31 QS
Fewest losses 1 1963 Koufax (24-1) in 31 QS
Most no decisions: 9 2010 Felix Hernandez (perhaps 1 more start), 1920-2009 8 1986 Mke Scott (17-7 in his 32 QSs)
Looking at 1920-2010 30+QS seasons, the records for the all games including non-QS games and relief appearances:
Fewest wins 14 2010 Felix Hernandez (perhaps 1 more start), 1920-2009 15 1965 Osteen (went 0-5 in non-QS games to finish overall at 15-15).
Other comments:
Is Felix 59 QS in consecutive seasons 2009-10 a record? No. Koufax 1965-6 had 71 (honorable mention Wilbur Wood 1971-2 70).
Looking at the distribution of 30+ QS seasons 1920-2009, 1960-9 had 20 while 1970-9 had 15.
Four decades had a single pitcher reach 30 QS in a season:
1930s was 1939 Bucky Walters
1950s was 1952 Robin Roberts
1990s was 1992 Maddux
2000s was 2002 Randy Johnson.
Clem Comly is the vice-president of Retrosheet and co-chair of SABR's statistical analysis committee while being a member of several other committees. He is also a Phillies fan.
Sunday, October 3, 2010
Blue Jays Set Isolated Power Record
Including the last game of the year, their team AVG is .248 while their SLG is .454. That gives them an ISO of .206, beating the record of .204 by the 1997 Mariners. The Blue Jays finish with 257 HRs, tied for 3rd best ever. They are the 14th team to have 240+ HRs and one of 7 of those teams to have 300+ 2Bs.
Their ISO was about 40% better than the league average since .206/.147 = 1.40. That is 6th best every and 2nd best since 1920, trailing only the fabled 1927 Yankees (don't call the cliche police on me-fabled is the only word I could think of). See my post from May 31 called Blue Jays On Record Power Pace.
They did hit better at home, with an ISO of .233 there and .182 on the road.
If we just looked at their road ISO relative to the league average, it would be .182/.147 = 1.238. So that was 23.8% above the league average and it would have been 34th best between 1920 and 2009. Pretty impressive.
Friday, October 1, 2010
Tim Linceum's Fluctuating Strikeout-To-Hit Ratio
About a month ago I posted Tim Linceum's Falling Strikeout-To-Hit Ratio.
Here are his ratios each month this year starting with April
43/22 = 1.95
40/33 = 1.21
34/33 = 1.03
35/42 = .833
27/33 = .818
52/31 = 1.68
In 2009 it was
261/168 = 1.55
In 2008 it was
265/182 = 1.46
For all of this year it is 1.19 = 231/194
Th NL average in 2010 is .833
I don't know how important this ratio is. Alot of young flame throwers see their strikeouts fall as they get older. But Lincecum turned things around in Sept., just in time for the Giants. I don't know how he did it, though.
Wednesday, September 29, 2010
May Day, May Day! Throw Konerko A Life Preserver
In his career, here is his OPS for each month starting with April
.863
.713
.919
.871
.906
.859
I noticed he had a bad May again this year. In every year of his career his OPS is lower in May than it is for the season. Sometimes alot lower. Has anyone ever seen anything like this? Is it unusual? Any reason why?
The White Sox have played more road games in May than home games during the course of his career. But that probably would not account for much of the difference. His career home OPS is .919 while on the road it is .791. That is only a .128 difference. But notice that it falls .150 and then goes back up .206. Those changes are much larger than his home/road split. If he were a slow starter, then April would be low. If he tailed off as the weather got hot, June would be low. But both April and June are high.
His OPS was .712 in May this year while it is .971 overall. His next lowest month this year is Sept. at .895. April was 1.197 while June was 1.000.
Sunday, September 26, 2010
Blue Jays Still Have Chance To Set Isolated Power Record
Including today's game, they have a .24762 AVG and a .45150 SLG. That gives them an ISO of .20388. That is just actually a little less than the record set by the Mariners in 1997, who had .20413. Their AVG was .28037 and their SLG was .48450. That puts them just 0.00025 ahead of the Blue Jays.
My first post on this was Blue Jays On Record Power Pace.
My first post on this was Blue Jays On Record Power Pace.
Wednesday, September 22, 2010
Twins Clinch Division Title Behind a .714 Second Half Winning Percentage
The Twins are 45-18 since the All-Star break. That .714 pct., as I mentioned last week, was the same one the 1927 Yankees had. The Twins were 46-42 at the break.
Who predicted, or could have predicted, that they would do so well in the 2nd half, especially without Morneau? Jim Thome has an OPS+ of 219 in the 2nd half, pretty close to what both Ruth and Gehrig had in 1927 (for the year Thome has an OPS+ of 175-that would be 3rd in the league if he qualified but he has only 335 PAs). His AVG-OBP-SLG since the break are .310-.450-.722.
Since the break the Twins' pitchers have given up just 39 HRs in 63 games while they gave up 92 in their first 88. I gave more details on their run last week. Scroll down to see some of those posts.
Update at 9:17 a.m.: Here are the OPS, OPS allowed and OPS differential for the 4 AL playoff teams in the 2nd half
Twins: .787-.690-.097
Yanks: .795-.733-.062
Rays: .737-.742-negative .005!
Rangers: .743-.696-.047
So the Twins clearly have been playing the best, although an easier schedule might have helped.
Monday, September 20, 2010
SABR Posts Link To Mark Kanter's Presentation On Home Field Advantage
Go to Does Extreme Home Field Advantage Exist?. The actual title might be "Why Do the Rockies Win More Than They Should at Home?" But I am not sure.
Saturday, September 18, 2010
Is Austin Jackson Getting Alot Of Infield Singles And Are They Partly Responsible For His High BABIP?
Jeff Passan at Yahoo mentions that Jackson has an historically high BABIP of .413 See Think you know baseball? No, you don’t.
It would be the highest since 1924. Jackson has a .161 AVG on balls in the infield according to Baseball Reference. But the league average is just .080. If we take half of his infield hits away, say 15, he then would be 16 for 191 on infield balls. That would lower his BABIP from 164/398 = .412 to 149/398 = .374. Still very high, but maybe not as historic.
He is fast with 10 3Bs this year as a RHB while stealing 24 with only 5 caught stealing. Maybe he beats out more grounders than average.
His average on hits to the outfield is .649 while the league average is .545. So he is above average here but not relatively as much as as in the infield. His GB/FB ratio is just about 2.22-1 while for the league it is about 1.23-1. Line drives are 27.3% of his non-bunt ABs while for the league it is 19.1%. His AVG on line drives is just about the league average, .722 vs. .725. So if you hit alot more line drives and you are fast, maybe you get a high BABIP. He strikes out 25.7% of the time while the league average is 17.5%. Maybe he just swings real hard, too.
Thursday, September 16, 2010
Is A Lower HR Allowed Rate A Big Reason For The Twins' Success In The 2nd Half?
The table below shows some stats for their pitching staff in the first half vs. the second half, with data coming from Baseball Reference. The numbers in the 2nd part of the table are all rates, with the stat being divided by PA.

Notice that their SO/BB ratio fell by 19%. If someone told you that this would happen, my guess is that you would have thought it would be bad news for the Twins. You can see that their SO rate is down and their BB rate is up (for those rates, I included HBP and IBBs in the rate). They have also allowed a higher single rate.
But there are big drop offs in 2Bs and HRs. A 45% drop in HR rate seems very large. They allowed 92 HRs in 88 games before the All-Star break and 33 in 57 games since the break. AVG and OBP did not change much. But SLG did, probably due to the lower rate on 2Bs and HRs (of course, fewer 2Bs might be the result of better fielding).
I don't know why the HR rate fell. Maybe more games at home, the opposition, the flyball rate, etc. Those are all just speculation.
The starters saw their AVG-OBP-SLG go from .282-.321-.454 to .252-.302-.362. A 92 point drop in SLG! But, the relievers saw the following change: .237-.296-.378 to .278-.339-.395. The starters saw their OPS fall .111 while the relievers had a .060 gain! In the 1st half, the starters faced 69.3% of the batters while in the 2nd it was 69.8%. So, although the relievers did worse and pitched the same relative amount in the 2nd half, the better performance all comes from the starters (although Duensing changed roles, becoming a starter).
Wednesday, September 15, 2010
July 15, 2010: The Twins Turned Into The 1927 Yankees
The Twins are 40-16 since the All-Star break. That is a .714 winning percentage. The same one the 1927 Yankees had. They were 110-44.
The Twins also did this without Justin Morneau. He has not played at all during this run. He played 81 games and had a WAR of 5.1, still tied for 8th best in the league right now (from Baseball Reference). His 179 OPS+ would be 2nd in the league to Miguel Cabrerra (181) if Morneau still qualified. Morneau had the following AVG-OBP-SLG: .345-.437-.618.
In the 2nd half, Jim Thome has had an OPS+ of 222. In 1927, Ruth had 226 and Gehrig had 221. Since the break, his AVG-OBP-SLG: .308-.444-.738. His OPS+ for the whole year is 173.
Joe Mauer has also picked it up, raising his OPS from .792 in the 1st half to .977 in the 2nd. One player who has seen increased playing time is Danny Valencia. He had only 58 AB in the 1st half with an OPS of .720 while in the 2nd he has had an OPS of .830 in 173 ABs. Another big jump comes from J. J. Hardy, who saw his OPS go from .607 to .837.
There were more details in yesterday's post on how the team performed in both halves.
But here are the ERAs of the Twins five starters, 1st half and 2nd half:
Pavano: 3.58-3.29
Baker: 4.87-4.03
Liriano: 3.86-2.41
Slowey: 4.64-3.47
Blackburn: 6.40-3.26
Brian Duensing made no starts in the first half. But 9 of his 11 games in the 2nd half were starts while compiling an overall ERA of 2.25. His OPS allowed as a starter is just .606, even better than as a reliever, which was .617.
Tuesday, September 14, 2010
Did The White Sox Blow It Or Did The Twins Win It?
I know it really isn't over yet, but the Twins have a 6 game lead. On July 20, the White Sox had a 3.5 game lead.
The Twins are 39-16 since the All-Star Break. If they had played .600 since then, the two teams would be tied. They were 46-42 prior to the All-Star break. Who could have predicted that they would play .700 since then, especially without Morneau? The Sox only went 30-26. That should have been enough to keep them in contention.
The Twins have allowed an OPS of .682 since then while the league average is .727. The Twins have allowed a .312 OBP and a .371 SLG while the average has been .323 & .404. Before the All-Star Break, they allowed an OPS of .745
The Twins batters saw their OPS jump from .762 pre All-Star to .779. So their OPS differential went from .017 to .097 before and after the break.
They have also beaten the White Sox 10-5 this year. If the White Sox were 7-8 vs. the Twins this year, they would only be two out. If they were to take 2 out of 3 in this upcoming series, they would only be 1 game out and the season series would finish at 9-9. So in a way, the Twins have just taken it away from the Sox by doing so well when they went head-to-head.
For their part, the White Sox hitters have had an OPS of .780 since the All-Star break while their pitchers have allowed a .735 OPS. A .045 differential is not bad. The relationship between OPS differential and winning pct is about
Pct = 1.25*OPSDIFF + .5
That would give the Sox a .556 differential and 31.25 wins. The Twins project out to .621 or 34.17 wins. In reality, the Twins have been 9.5 games better than the Sox in the 2nd half. The OSPDIFF says the teams' W-L record to be:
Twins 34.17-20.83
Sox 31.25-24.75
That makes the Twins 3.42 games better since the All-Star break. The difference could be that the Twins have made 25 fewer errors this year. Also, in the 2nd half, the White Sox OBP differential is only .007 while it is .033 for the Twins. Since OBP is more important than SLG, this could be the key.
In the 2nd half the Sox have outscored their opponents 284-244. The Twins have outscored their opponents 284-196. That gives the Sox a Pythagorean .575 pct or a 32.22-23.78 record. The Twins project out to a .677 pct. or a 37.26-17.74 record. That predicts that the Twins would have been about 5.5 games better than the Sox since the break.
This implies that the Twins might be winning some close games that the Sox are not. In fact, since the All-Star break, the Twins have a 4-1 record vs. the Sox in 1-run games. A quick "eye balling" of Baseball Reference shows the Sox to be 7-11 since the break in 1-run games while the Twins are 15-7. That is 6 games better, the lead the Twins have.
Sunday, September 12, 2010
Has Baserunning Helped The Rays This Year?
It looks like it has. They seem to be scoring more runs than their OBP and SLG would normally indicate. The following equation shows the relationship between team runs per game and OBP & SLG for all teams from 2007-09:
R/G = 11.595*SLG + 16.04*OBP - 5.52
The Rays have a .338 OBP & a .410 SLG. That predicts 4.66 runs per game yet they are actually scoring 5.11. That is .45 more than expected and the next highest positive differential is about .30 for the Padres
I then used an equation which included GDPs, SBs and CSs per game. It was
R/G = -0.0556*GDP - 0.182*CS + 0.105*SB + 11.19*OBP + 16.34*SLG - 5.43
That predicted that the Rays would score 4.71 runs per game, still well below their rate of 5.11. Then I added in 4 other baserunning variables: the % of runners on first who make it to third on a single (13%), bases taken, like on fly balls and wild pitches (BT), reaching on errors (ROE), and outs on base, like getting thrown out trying for an extra base (data from Baseball Reference). The last three were all per game.
Here is the equation:
R/G = -.025*GDP - .347*CS + .083*SB + 11*SLG + 14.59*OBP + 1.17*13% + .359*BT - .426*OOB + . 699*ROE - 5.48
Plugging in all of the Rays data would predict 4.87 runs per game. That jumps us alot closer to the 5.11. Adding in all of the baserunning data closes almost half the original gap of .45 between their actual runs and predicted runs.
I also tried breaking down OBP & SLG into cases of none on and runners on base (ROB). Here is the equation:
R/G = 7.83*ROBSLG + 9.26*ROBOBP + 3.66NONESLG + 8.53*NONEOBP - 6.12
Notice how SLG is twice as important with runners on than with none on. With none on, the Rays have an OBP & SLG of .322 & .396. With ROB, they have .357 & .429. Plugging all that in to the equation predicts 4.74 runs per game. That is .08 higher than the very first equation reported (4.65). So if we combined that with the findings from baserunning, we would probably get something over 4.87 and we have a good idea why the Rays are scoring so many runs this year.
Wednesday, September 8, 2010
Could A Person Watch Every Game In A League For A Whole Season?
With all the technology we have, it seems like it could be possible. Maybe a good writer would be willing to try this or someone who works at ESPN. In the AL, there are normally, at most, 7 games in a day. If you do alot of fast forwarding, you might be able to watch each game in an hour. So it would be like a full time job. You could blog abot it every day. Maybe even turn it into a book.
No one has ever done this before. A good writer might be able to tell a good story or be able to bring something new to baseball analysis. It could drive someone crazy, too. Then there are the inter-league games. If you were doing the AL, you would have to watch 14 games per day. I don't think I would be willing to try it and even if I could take a leave of absense from my teaching job, it would be tough.
When it comes to awards and all-star voting, in a way, no one is really qualified to vote, since no one sees every game. But maybe now it would be different. Maybe several writers could do this and then it would be fun to hear all their different viewpoints.
Sunday, September 5, 2010
Lost RBIs Found, Part 2
This another guest post by Tom Ruane. The first part was Lost RBIs Of Ruth, Gehrig, Others Discovered
Nearly two weeks ago, I sent out a note on several games from 1920 to 1949 in which teams scored at least three runs without an official RBI. As I pointed out at the time, some of these seemed to be legitimate cases where no RBI should have been credited, but most appeared to be oversights on the part of the official scorer. Simply put, they forgot to fill in the RBIs on the sheets they submitted. In addition to providing information on these games, I asked for help locating detailed accounts of some of these games.
I would like to thank Mark Pankin, Ron Antonucci, Keith Carlson and Ron Selter for their help in locating accounts of all of the games on the "missing" list. I would also like to apologize in advance if I forgot to thank anyone.
I also decided to extend my search for missing RBIs by looking at all games where a team scored two runs without being credited with an RBIs. As expected, many of these were cases where both runs scored on errors, wild pitches, steals of home and so on. Others reflect a different interpretation of what an RBI was (and I will have more to say on this subject in a later post). And other cases are once again games in which it appears that the official scorer forgot about RBIs.
So here is an updated version of my earlier list, this time including those two runs games. Once again, the number before the date is the number of runs scored by the team in the game.


* - only source was newspaper box score
+ - missing a detailed account of the game
As you no doubt noticed, extending the search in this manner added a handful of new "missing" games:
1920-9-19(2) WS1 @ DET
1921-6-26 CIN @ SLN
1921-7-24 SLA V BOS
1922-6-27(1) BOS @ PHA
1923-5-27 SLA V CLE
1926-5-1 SLA V DET
1927-9-30 PHI @ BSN
Nearly two weeks ago, I sent out a note on several games from 1920 to 1949 in which teams scored at least three runs without an official RBI. As I pointed out at the time, some of these seemed to be legitimate cases where no RBI should have been credited, but most appeared to be oversights on the part of the official scorer. Simply put, they forgot to fill in the RBIs on the sheets they submitted. In addition to providing information on these games, I asked for help locating detailed accounts of some of these games.
I would like to thank Mark Pankin, Ron Antonucci, Keith Carlson and Ron Selter for their help in locating accounts of all of the games on the "missing" list. I would also like to apologize in advance if I forgot to thank anyone.
I also decided to extend my search for missing RBIs by looking at all games where a team scored two runs without being credited with an RBIs. As expected, many of these were cases where both runs scored on errors, wild pitches, steals of home and so on. Others reflect a different interpretation of what an RBI was (and I will have more to say on this subject in a later post). And other cases are once again games in which it appears that the official scorer forgot about RBIs.
So here is an updated version of my earlier list, this time including those two runs games. Once again, the number before the date is the number of runs scored by the team in the game.

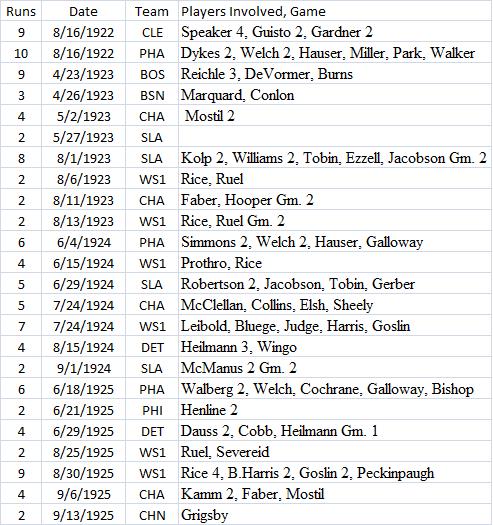


* - only source was newspaper box score
+ - missing a detailed account of the game
As you no doubt noticed, extending the search in this manner added a handful of new "missing" games:
1920-9-19(2) WS1 @ DET
1921-6-26 CIN @ SLN
1921-7-24 SLA V BOS
1922-6-27(1) BOS @ PHA
1923-5-27 SLA V CLE
1926-5-1 SLA V DET
1927-9-30 PHI @ BSN
Wednesday, September 1, 2010
Update on Blue Jays and Astros Offenses
My first post on this was Astros Offense On Record Setting Low Pace. Right now their OPS is .663 and the league average is .727. So .663/.72 = .912, giving them a relative OPS of about 91. That would put them in the bottom 25 since 1993.
The Astros have an OPS+ of 78 according to Baseball Reference. It takes park effects into effect as well as the league average (it is calculated a little differently than above). That is last in the NL this year. The Pirates are next lowest at 81. The lowest team OPS+ I found going all the way back to 1920 was 69 for the 1920 Philadelphia A's. But the Mariners are even lower now than the Astros with a 77. The last time any team finished a season below 80 was in 2004, the Expos (78) and the Diamondbacks (77).
The Blue Jays have an isolated power (ISO) of .205 since their SLG is .455 and their AVG is .250. That is about the same as the all-time record of .205 by the 1997 Mariners. Relative to the league average, it would be the 6th highest since 1900, at 139 (.205/.148 = 1.39). The league ISO in the AL this year is .148. The 1927 Yankees are the highest in relative ISO at 153. The Jays ISO is .233 at home and .180 on the road.
My first post on this was Blue Jays On Record Power Pace.
Sunday, August 29, 2010
Did Earl Averill Have A Tremendous Walk-To-Strikeout Ratio?
Joe Posnanski recently wrote at his blog the following:
I wrote the following comment there:
So it is not surprising that we might see a guy like Averill and, not knowing the context, be impressed. Over the past five years in MLB, there have been 80,089 walks and 160,963 strikeouts. That means .5 walks for every HR. Averill's ratio was three times that. But there just were not that many strikeouts when he played. How did he compare to other players? The table below shows the top 25 in walk-to-strikeout ratio from 1929-1940 with 2500+ PAs.

Averill is not in the top 25. He was 60th out of 152 players. Yes, those numbers are correct for Sewell. One year his ratio was 16-1. Another year it was 17.75-1. If I only look at guys with 5000+ PAs, Averill is in the top 25, as the table below shows. But, there were only 38 such players.

Now he was a HR hitter, with 238 in his career. They sometimes strikeout alot. So I looked at all players from 1920-1950 who hit 200+ HRs. Here are the leaders. He is there, but there were only a total of 29 guys in the group.

Finally, there were not many big strikeout pitchers in those days. The two lists below show the leaders in both leagues from 1929-40. That guy named Feller sure changed things. Averill did not face him much since he played most of his career for the Indians.
1929--LEFTY GROVE 170
1930--LEFTY GROVE 209
1931--LEFTY GROVE 175
1932--RED RUFFING 190
1933--LEFTY GOMEZ 163
1934--LEFTY GOMEZ 158
1935--TOMMY BRIDGES 163
1936--TOMMY BRIDGES 175
1937--LEFTY GOMEZ 194
1938--BOB FELLER 240
1939--BOB FELLER 246
1940--BOB FELLER 261
1929--PAT MALONE 166
1930--WILD BILL HALLAHAN 177
1931--WILD BILL HALLAHAN 159
1932--DIZZY DEAN 191
1933--DIZZY DEAN 199
1934--DIZZY DEAN 195
1935--DIZZY DEAN 190
1936--VAN LINGLE MUNGO 238
1937--CARL HUBBELL 159
1938--CLAY BRYANT 135
1939--CLAUDE PASSEAU 137
--BUCKY WALTERS 137
1940--KIRBY HIGBE 137
"As you have already seen, the only two Hall of Famers who hit home runs in their first at-bats — Averill and Wilhelm — were not famous for home runs. Averill did have three 30-homer seasons, but it was his all-around play, including a tremendous walk-to-strikeout [ratio] (774 walks to 518 Ks) and superior defense, that made him a terrific player."See A Homer His First Time Up!
I wrote the following comment there:
"That walk-to-strikeout ratio is perhaps not so tremendous. It is 1.496. But using the Lee Sinins Complete Baseball Encyclopedia, I found that the average player (non-pitchers) in Averill’s era had a ratio of 692 to 523, which is 1.32. That means that Averill was about 13% better than average since 1.496/1.32 = 1.13.Baseball history often surprises us (well, it surprises me alot). For example, I discovered that Fritz Maisel, in 1914, had perhaps the greatest base stealing season before Maury Wills in 1962 (taking steals, caught stealing, times reaching first base and the league average into account). I had never heard of him before. See What Were The Best Relative Base Stealing Seasons? There have been many times I started calling up lists of leaders in stats where I start to see names for the first time.
Imagine that the average player hits 15 HRs in a full season. If you hit 13% more, you hit about 17. This is not tremendous."
So it is not surprising that we might see a guy like Averill and, not knowing the context, be impressed. Over the past five years in MLB, there have been 80,089 walks and 160,963 strikeouts. That means .5 walks for every HR. Averill's ratio was three times that. But there just were not that many strikeouts when he played. How did he compare to other players? The table below shows the top 25 in walk-to-strikeout ratio from 1929-1940 with 2500+ PAs.

Averill is not in the top 25. He was 60th out of 152 players. Yes, those numbers are correct for Sewell. One year his ratio was 16-1. Another year it was 17.75-1. If I only look at guys with 5000+ PAs, Averill is in the top 25, as the table below shows. But, there were only 38 such players.

Now he was a HR hitter, with 238 in his career. They sometimes strikeout alot. So I looked at all players from 1920-1950 who hit 200+ HRs. Here are the leaders. He is there, but there were only a total of 29 guys in the group.

Finally, there were not many big strikeout pitchers in those days. The two lists below show the leaders in both leagues from 1929-40. That guy named Feller sure changed things. Averill did not face him much since he played most of his career for the Indians.
1929--LEFTY GROVE 170
1930--LEFTY GROVE 209
1931--LEFTY GROVE 175
1932--RED RUFFING 190
1933--LEFTY GOMEZ 163
1934--LEFTY GOMEZ 158
1935--TOMMY BRIDGES 163
1936--TOMMY BRIDGES 175
1937--LEFTY GOMEZ 194
1938--BOB FELLER 240
1939--BOB FELLER 246
1940--BOB FELLER 261
1929--PAT MALONE 166
1930--WILD BILL HALLAHAN 177
1931--WILD BILL HALLAHAN 159
1932--DIZZY DEAN 191
1933--DIZZY DEAN 199
1934--DIZZY DEAN 195
1935--DIZZY DEAN 190
1936--VAN LINGLE MUNGO 238
1937--CARL HUBBELL 159
1938--CLAY BRYANT 135
1939--CLAUDE PASSEAU 137
--BUCKY WALTERS 137
1940--KIRBY HIGBE 137
Thursday, August 26, 2010
Tim Linceum's Falling Strikeout-To-Hit Ratio
Here are his ratios each month this year starting with April
43/22 = 1.95
40/33 = 1.21
34/33 = 1.03
35/42 = .833
21/28 = .75 (after Friday's start it is 27/33 = .818)
Last year it was
261/168 = 1.55
In 2008 it was
265/182 = 1.46
For all of this year it is 1.09 = 173/158
Th NL average in 2010 is 14751/17652 =.834
I don't know how important this ratio is. Alot of young flame throwers see their strikeouts fall as they get older.
Tim Kawakami of the Mercury News has a possible explanation. Go to The math on Tim Lincecum: Lots of pitches, lots of innings, not enough MPH (lately).
Tuesday, August 24, 2010
Lost RBIs Of Ruth, Gehrig, Others Discovered
This is a guest post by Tom Ruane
Prior to the SABR convention, someone pointed out to us that our box score of the second game of the June 1, 1930, double-header between the Giants and the Braves showed the visiting Giants scoring 16 runs without a single RBI. Our box score reflects the official version of the game. According to both our play-by-play account and numerous newspaper box scores, the Giants should have had 14 RBIs.
I figured that there were probably several other games like this from 1920 to 1949. So I wrote a program to identify all the games where a team scored three runs or more without being credited with an RBI. My program found 71 games. Some of these games were not official errors. For example, on July 2, 1948, the Cubs scored five runs and all of these runs were scored as a result of a wild pitch, balk and errors.
And just so I won't being accused of completely burying the lead, the changes suggested below would have the following effect on the 1928 AL RBI leadership:
Before:
1 Babe Ruth 142
1 Lou Gehrig 142
3 Bob Meusel 113
4 Heinie Manush 108
After:
1 Babe Ruth 144
2 Lou Gehrig 143
3 Bob Meusel 116
4 Harry Heilmann 109
4 Heinie Manush 109
4 Al Simmons 109
But more on this later.
Here are the games I found that are (or might be) official errors along with the RBIs I think are missing. The number before the date is the number of runs scored by the team in the game.


x - noticed when fixing the other team's RBIs
* - only source was newspaper box score
+ - missing a detailed account of the game
Among other things, these updates could have the following effect:
1920 - George Sisler moves from a tie into 2nd place all by himself. Jacobson drops into 3rd place.
1922 - Tillie Walker's added RBI gives him an even 100 for the year.
1924 - Goose Goslin's league-leading total becomes 130. Harry Heilmann moves ahead of Hauser into 4th place with 117.
1926 - George Burns moves from a tie into 2nd place all by himself. Lazzeri drops into 3rd place.
1927 - Paul Waner's league-leading total becomes 132.
1928 - As mentioned above, Babe Ruth moves from a tie for the league leadership into first place with 144 RBIs. Lou Gehrig's total increases to 143 RBIs but he still drops into second place. Al Simmons and Harry Heilmann move into a fourth-place tie with Heinie Manush with 109 RBIs. All three have their totals increase, but Simmons and Heilmann's increase by two and Manush's only increases by one.
I said "could" have the following effect because this is by no means the last word on RBIs for this period. I suspect there are several hundred remaining errors in the RBI data from this period and expect these numbers to continue to change as more research is done in this area.
To highlight this last point, I thought it might be interesting to take a closer look at Gehrig and Ruth's RBI totals for 1928. Since this is the only proposed change that might affect a league leader, I went and looked at all of their games that season. Here's what I found.
4-18: Ruth +2 and Gehrig +1. Mentioned above - no RBIs credited to team.
5-10: Gehrig -1. It looks like his SH was put in the RBI column of the dailies.
5-26: Ruth +2. He was not given credit for his RBIs on a ground-out and sacrifice fly.
5-28: Ruth +1. He was not given credit for RBI on bases-loaded walk.
6-28: Gehrig +1 and Ruth -1. Ruth given RBI on Gehrig's sacrifice fly.
8-6: Gehrig +1. He was not given credit for RBI on force-out at second with the bases loaded. The attempt to double-up Gehrig resulted in a throw to an unoccupied base. Two runs scored on the play, but I think Gehrig should have given one RBI.
8-7: Gehrig +1 and Ruth -1. Ruth given credit for one of Gehrig's RBIs in the first inning.
9-9: Gehrig +1. Two errors here. First of all, two RBIs were put in the strikeout column of the dailies. And assuming that the intent was to give him two RBIs in the game, that means he was incorrectly credited with an RBI when he tripled and scored on an error. Either way, Gehrig was credited with no official RBIs and should have had one.
9-16: Gehrig +1. no RBI credited on solo home run.
9-18: newspaper box scores do not credit Gehrig with an RBI in the game, but I can not find a complete enough account of the scoring to make a case for a change.
So what is the net effect of all these changes. Well, they result in 3 additional RBIs for Ruth and 5 for Gehrig. So instead of having Ruth take sole ownership of the RBI title (144-143), it should be Gehrig in the top spot by 147-145. And even if further research supports removing his RBI on 9-18, he would still own the title outright.
One final note on Gehrig's RBI totals: if we adjust his 1928 figure from 142 to 147, that would also change his career mark from 1995 to an even 2000. But there is no reason to think that his totals from other years won't change as well. As a matter of fact, incomplete research from other seasons have him with one less RBI than officially credited in 1926, 1929 and 1938 (giving him an adjusted total of 1997), and I'd be very surprised if there weren't several more changes yet to come.
Finally, a request for help. If anyone has access to a Philadelphia, St. Louis, Cleveland or Detroit library, I would love to have copies of the local game stories for the eight games above marked with a "+". They are:
1923-4-23 BOS @ PHA
1923-8-1(2) SLA @ PHA
1924-6-4 PHA @ CLE
1924-6-29 SLA @ CHA
1926-4-20 SLA @ DET
1926-6-18 PHA @ DET
1926-7-22 SLA @ BOS
1926-8-6 PIT @ BSN
Tom Ruane, a computer programmer in Poughkeepsie, N.Y., is a member of Retrosheet's board of directors. He has published articles in "The Baseball Research Journal" and "By The Numbers." He won SABR's highest honor, the Bob Davids Award, in 2009.
Subscribe to:
Comments (Atom)