In his career, here is his OPS for each month starting with April
.863
.713
.919
.871
.906
.859
I noticed he had a bad May again this year. In every year of his career his OPS is lower in May than it is for the season. Sometimes alot lower. Has anyone ever seen anything like this? Is it unusual? Any reason why?
The White Sox have played more road games in May than home games during the course of his career. But that probably would not account for much of the difference. His career home OPS is .919 while on the road it is .791. That is only a .128 difference. But notice that it falls .150 and then goes back up .206. Those changes are much larger than his home/road split. If he were a slow starter, then April would be low. If he tailed off as the weather got hot, June would be low. But both April and June are high.
His OPS was .712 in May this year while it is .971 overall. His next lowest month this year is Sept. at .895. April was 1.197 while June was 1.000.
Wednesday, September 29, 2010

Sunday, September 26, 2010
Blue Jays Still Have Chance To Set Isolated Power Record
Including today's game, they have a .24762 AVG and a .45150 SLG. That gives them an ISO of .20388. That is just actually a little less than the record set by the Mariners in 1997, who had .20413. Their AVG was .28037 and their SLG was .48450. That puts them just 0.00025 ahead of the Blue Jays.
My first post on this was Blue Jays On Record Power Pace.
My first post on this was Blue Jays On Record Power Pace.
Wednesday, September 22, 2010
Twins Clinch Division Title Behind a .714 Second Half Winning Percentage
The Twins are 45-18 since the All-Star break. That .714 pct., as I mentioned last week, was the same one the 1927 Yankees had. The Twins were 46-42 at the break.
Who predicted, or could have predicted, that they would do so well in the 2nd half, especially without Morneau? Jim Thome has an OPS+ of 219 in the 2nd half, pretty close to what both Ruth and Gehrig had in 1927 (for the year Thome has an OPS+ of 175-that would be 3rd in the league if he qualified but he has only 335 PAs). His AVG-OBP-SLG since the break are .310-.450-.722.
Since the break the Twins' pitchers have given up just 39 HRs in 63 games while they gave up 92 in their first 88. I gave more details on their run last week. Scroll down to see some of those posts.
Update at 9:17 a.m.: Here are the OPS, OPS allowed and OPS differential for the 4 AL playoff teams in the 2nd half
Twins: .787-.690-.097
Yanks: .795-.733-.062
Rays: .737-.742-negative .005!
Rangers: .743-.696-.047
So the Twins clearly have been playing the best, although an easier schedule might have helped.
Who predicted, or could have predicted, that they would do so well in the 2nd half, especially without Morneau? Jim Thome has an OPS+ of 219 in the 2nd half, pretty close to what both Ruth and Gehrig had in 1927 (for the year Thome has an OPS+ of 175-that would be 3rd in the league if he qualified but he has only 335 PAs). His AVG-OBP-SLG since the break are .310-.450-.722.
Since the break the Twins' pitchers have given up just 39 HRs in 63 games while they gave up 92 in their first 88. I gave more details on their run last week. Scroll down to see some of those posts.
Update at 9:17 a.m.: Here are the OPS, OPS allowed and OPS differential for the 4 AL playoff teams in the 2nd half
Twins: .787-.690-.097
Yanks: .795-.733-.062
Rays: .737-.742-negative .005!
Rangers: .743-.696-.047
So the Twins clearly have been playing the best, although an easier schedule might have helped.
Monday, September 20, 2010
SABR Posts Link To Mark Kanter's Presentation On Home Field Advantage
Go to Does Extreme Home Field Advantage Exist?. The actual title might be "Why Do the Rockies Win More Than They Should at Home?" But I am not sure.
Saturday, September 18, 2010
Is Austin Jackson Getting Alot Of Infield Singles And Are They Partly Responsible For His High BABIP?
Jeff Passan at Yahoo mentions that Jackson has an historically high BABIP of .413 See Think you know baseball? No, you don’t.
It would be the highest since 1924. Jackson has a .161 AVG on balls in the infield according to Baseball Reference. But the league average is just .080. If we take half of his infield hits away, say 15, he then would be 16 for 191 on infield balls. That would lower his BABIP from 164/398 = .412 to 149/398 = .374. Still very high, but maybe not as historic.
He is fast with 10 3Bs this year as a RHB while stealing 24 with only 5 caught stealing. Maybe he beats out more grounders than average.
His average on hits to the outfield is .649 while the league average is .545. So he is above average here but not relatively as much as as in the infield. His GB/FB ratio is just about 2.22-1 while for the league it is about 1.23-1. Line drives are 27.3% of his non-bunt ABs while for the league it is 19.1%. His AVG on line drives is just about the league average, .722 vs. .725. So if you hit alot more line drives and you are fast, maybe you get a high BABIP. He strikes out 25.7% of the time while the league average is 17.5%. Maybe he just swings real hard, too.
It would be the highest since 1924. Jackson has a .161 AVG on balls in the infield according to Baseball Reference. But the league average is just .080. If we take half of his infield hits away, say 15, he then would be 16 for 191 on infield balls. That would lower his BABIP from 164/398 = .412 to 149/398 = .374. Still very high, but maybe not as historic.
He is fast with 10 3Bs this year as a RHB while stealing 24 with only 5 caught stealing. Maybe he beats out more grounders than average.
His average on hits to the outfield is .649 while the league average is .545. So he is above average here but not relatively as much as as in the infield. His GB/FB ratio is just about 2.22-1 while for the league it is about 1.23-1. Line drives are 27.3% of his non-bunt ABs while for the league it is 19.1%. His AVG on line drives is just about the league average, .722 vs. .725. So if you hit alot more line drives and you are fast, maybe you get a high BABIP. He strikes out 25.7% of the time while the league average is 17.5%. Maybe he just swings real hard, too.
Thursday, September 16, 2010
Is A Lower HR Allowed Rate A Big Reason For The Twins' Success In The 2nd Half?
The table below shows some stats for their pitching staff in the first half vs. the second half, with data coming from Baseball Reference. The numbers in the 2nd part of the table are all rates, with the stat being divided by PA.

Notice that their SO/BB ratio fell by 19%. If someone told you that this would happen, my guess is that you would have thought it would be bad news for the Twins. You can see that their SO rate is down and their BB rate is up (for those rates, I included HBP and IBBs in the rate). They have also allowed a higher single rate.
But there are big drop offs in 2Bs and HRs. A 45% drop in HR rate seems very large. They allowed 92 HRs in 88 games before the All-Star break and 33 in 57 games since the break. AVG and OBP did not change much. But SLG did, probably due to the lower rate on 2Bs and HRs (of course, fewer 2Bs might be the result of better fielding).
I don't know why the HR rate fell. Maybe more games at home, the opposition, the flyball rate, etc. Those are all just speculation.
The starters saw their AVG-OBP-SLG go from .282-.321-.454 to .252-.302-.362. A 92 point drop in SLG! But, the relievers saw the following change: .237-.296-.378 to .278-.339-.395. The starters saw their OPS fall .111 while the relievers had a .060 gain! In the 1st half, the starters faced 69.3% of the batters while in the 2nd it was 69.8%. So, although the relievers did worse and pitched the same relative amount in the 2nd half, the better performance all comes from the starters (although Duensing changed roles, becoming a starter).

Notice that their SO/BB ratio fell by 19%. If someone told you that this would happen, my guess is that you would have thought it would be bad news for the Twins. You can see that their SO rate is down and their BB rate is up (for those rates, I included HBP and IBBs in the rate). They have also allowed a higher single rate.
But there are big drop offs in 2Bs and HRs. A 45% drop in HR rate seems very large. They allowed 92 HRs in 88 games before the All-Star break and 33 in 57 games since the break. AVG and OBP did not change much. But SLG did, probably due to the lower rate on 2Bs and HRs (of course, fewer 2Bs might be the result of better fielding).
I don't know why the HR rate fell. Maybe more games at home, the opposition, the flyball rate, etc. Those are all just speculation.
The starters saw their AVG-OBP-SLG go from .282-.321-.454 to .252-.302-.362. A 92 point drop in SLG! But, the relievers saw the following change: .237-.296-.378 to .278-.339-.395. The starters saw their OPS fall .111 while the relievers had a .060 gain! In the 1st half, the starters faced 69.3% of the batters while in the 2nd it was 69.8%. So, although the relievers did worse and pitched the same relative amount in the 2nd half, the better performance all comes from the starters (although Duensing changed roles, becoming a starter).
Wednesday, September 15, 2010
July 15, 2010: The Twins Turned Into The 1927 Yankees
The Twins are 40-16 since the All-Star break. That is a .714 winning percentage. The same one the 1927 Yankees had. They were 110-44.
The Twins also did this without Justin Morneau. He has not played at all during this run. He played 81 games and had a WAR of 5.1, still tied for 8th best in the league right now (from Baseball Reference). His 179 OPS+ would be 2nd in the league to Miguel Cabrerra (181) if Morneau still qualified. Morneau had the following AVG-OBP-SLG: .345-.437-.618.
In the 2nd half, Jim Thome has had an OPS+ of 222. In 1927, Ruth had 226 and Gehrig had 221. Since the break, his AVG-OBP-SLG: .308-.444-.738. His OPS+ for the whole year is 173.
Joe Mauer has also picked it up, raising his OPS from .792 in the 1st half to .977 in the 2nd. One player who has seen increased playing time is Danny Valencia. He had only 58 AB in the 1st half with an OPS of .720 while in the 2nd he has had an OPS of .830 in 173 ABs. Another big jump comes from J. J. Hardy, who saw his OPS go from .607 to .837.
There were more details in yesterday's post on how the team performed in both halves.
But here are the ERAs of the Twins five starters, 1st half and 2nd half:
Pavano: 3.58-3.29
Baker: 4.87-4.03
Liriano: 3.86-2.41
Slowey: 4.64-3.47
Blackburn: 6.40-3.26
Brian Duensing made no starts in the first half. But 9 of his 11 games in the 2nd half were starts while compiling an overall ERA of 2.25. His OPS allowed as a starter is just .606, even better than as a reliever, which was .617.
The Twins also did this without Justin Morneau. He has not played at all during this run. He played 81 games and had a WAR of 5.1, still tied for 8th best in the league right now (from Baseball Reference). His 179 OPS+ would be 2nd in the league to Miguel Cabrerra (181) if Morneau still qualified. Morneau had the following AVG-OBP-SLG: .345-.437-.618.
In the 2nd half, Jim Thome has had an OPS+ of 222. In 1927, Ruth had 226 and Gehrig had 221. Since the break, his AVG-OBP-SLG: .308-.444-.738. His OPS+ for the whole year is 173.
Joe Mauer has also picked it up, raising his OPS from .792 in the 1st half to .977 in the 2nd. One player who has seen increased playing time is Danny Valencia. He had only 58 AB in the 1st half with an OPS of .720 while in the 2nd he has had an OPS of .830 in 173 ABs. Another big jump comes from J. J. Hardy, who saw his OPS go from .607 to .837.
There were more details in yesterday's post on how the team performed in both halves.
But here are the ERAs of the Twins five starters, 1st half and 2nd half:
Pavano: 3.58-3.29
Baker: 4.87-4.03
Liriano: 3.86-2.41
Slowey: 4.64-3.47
Blackburn: 6.40-3.26
Brian Duensing made no starts in the first half. But 9 of his 11 games in the 2nd half were starts while compiling an overall ERA of 2.25. His OPS allowed as a starter is just .606, even better than as a reliever, which was .617.
Tuesday, September 14, 2010
Did The White Sox Blow It Or Did The Twins Win It?
I know it really isn't over yet, but the Twins have a 6 game lead. On July 20, the White Sox had a 3.5 game lead.
The Twins are 39-16 since the All-Star Break. If they had played .600 since then, the two teams would be tied. They were 46-42 prior to the All-Star break. Who could have predicted that they would play .700 since then, especially without Morneau? The Sox only went 30-26. That should have been enough to keep them in contention.
The Twins have allowed an OPS of .682 since then while the league average is .727. The Twins have allowed a .312 OBP and a .371 SLG while the average has been .323 & .404. Before the All-Star Break, they allowed an OPS of .745
The Twins batters saw their OPS jump from .762 pre All-Star to .779. So their OPS differential went from .017 to .097 before and after the break.
They have also beaten the White Sox 10-5 this year. If the White Sox were 7-8 vs. the Twins this year, they would only be two out. If they were to take 2 out of 3 in this upcoming series, they would only be 1 game out and the season series would finish at 9-9. So in a way, the Twins have just taken it away from the Sox by doing so well when they went head-to-head.
For their part, the White Sox hitters have had an OPS of .780 since the All-Star break while their pitchers have allowed a .735 OPS. A .045 differential is not bad. The relationship between OPS differential and winning pct is about
Pct = 1.25*OPSDIFF + .5
That would give the Sox a .556 differential and 31.25 wins. The Twins project out to .621 or 34.17 wins. In reality, the Twins have been 9.5 games better than the Sox in the 2nd half. The OSPDIFF says the teams' W-L record to be:
Twins 34.17-20.83
Sox 31.25-24.75
That makes the Twins 3.42 games better since the All-Star break. The difference could be that the Twins have made 25 fewer errors this year. Also, in the 2nd half, the White Sox OBP differential is only .007 while it is .033 for the Twins. Since OBP is more important than SLG, this could be the key.
In the 2nd half the Sox have outscored their opponents 284-244. The Twins have outscored their opponents 284-196. That gives the Sox a Pythagorean .575 pct or a 32.22-23.78 record. The Twins project out to a .677 pct. or a 37.26-17.74 record. That predicts that the Twins would have been about 5.5 games better than the Sox since the break.
This implies that the Twins might be winning some close games that the Sox are not. In fact, since the All-Star break, the Twins have a 4-1 record vs. the Sox in 1-run games. A quick "eye balling" of Baseball Reference shows the Sox to be 7-11 since the break in 1-run games while the Twins are 15-7. That is 6 games better, the lead the Twins have.
The Twins are 39-16 since the All-Star Break. If they had played .600 since then, the two teams would be tied. They were 46-42 prior to the All-Star break. Who could have predicted that they would play .700 since then, especially without Morneau? The Sox only went 30-26. That should have been enough to keep them in contention.
The Twins have allowed an OPS of .682 since then while the league average is .727. The Twins have allowed a .312 OBP and a .371 SLG while the average has been .323 & .404. Before the All-Star Break, they allowed an OPS of .745
The Twins batters saw their OPS jump from .762 pre All-Star to .779. So their OPS differential went from .017 to .097 before and after the break.
They have also beaten the White Sox 10-5 this year. If the White Sox were 7-8 vs. the Twins this year, they would only be two out. If they were to take 2 out of 3 in this upcoming series, they would only be 1 game out and the season series would finish at 9-9. So in a way, the Twins have just taken it away from the Sox by doing so well when they went head-to-head.
For their part, the White Sox hitters have had an OPS of .780 since the All-Star break while their pitchers have allowed a .735 OPS. A .045 differential is not bad. The relationship between OPS differential and winning pct is about
Pct = 1.25*OPSDIFF + .5
That would give the Sox a .556 differential and 31.25 wins. The Twins project out to .621 or 34.17 wins. In reality, the Twins have been 9.5 games better than the Sox in the 2nd half. The OSPDIFF says the teams' W-L record to be:
Twins 34.17-20.83
Sox 31.25-24.75
That makes the Twins 3.42 games better since the All-Star break. The difference could be that the Twins have made 25 fewer errors this year. Also, in the 2nd half, the White Sox OBP differential is only .007 while it is .033 for the Twins. Since OBP is more important than SLG, this could be the key.
In the 2nd half the Sox have outscored their opponents 284-244. The Twins have outscored their opponents 284-196. That gives the Sox a Pythagorean .575 pct or a 32.22-23.78 record. The Twins project out to a .677 pct. or a 37.26-17.74 record. That predicts that the Twins would have been about 5.5 games better than the Sox since the break.
This implies that the Twins might be winning some close games that the Sox are not. In fact, since the All-Star break, the Twins have a 4-1 record vs. the Sox in 1-run games. A quick "eye balling" of Baseball Reference shows the Sox to be 7-11 since the break in 1-run games while the Twins are 15-7. That is 6 games better, the lead the Twins have.
Sunday, September 12, 2010
Has Baserunning Helped The Rays This Year?
It looks like it has. They seem to be scoring more runs than their OBP and SLG would normally indicate. The following equation shows the relationship between team runs per game and OBP & SLG for all teams from 2007-09:
R/G = 11.595*SLG + 16.04*OBP - 5.52
The Rays have a .338 OBP & a .410 SLG. That predicts 4.66 runs per game yet they are actually scoring 5.11. That is .45 more than expected and the next highest positive differential is about .30 for the Padres
I then used an equation which included GDPs, SBs and CSs per game. It was
R/G = -0.0556*GDP - 0.182*CS + 0.105*SB + 11.19*OBP + 16.34*SLG - 5.43
That predicted that the Rays would score 4.71 runs per game, still well below their rate of 5.11. Then I added in 4 other baserunning variables: the % of runners on first who make it to third on a single (13%), bases taken, like on fly balls and wild pitches (BT), reaching on errors (ROE), and outs on base, like getting thrown out trying for an extra base (data from Baseball Reference). The last three were all per game.
Here is the equation:
R/G = -.025*GDP - .347*CS + .083*SB + 11*SLG + 14.59*OBP + 1.17*13% + .359*BT - .426*OOB + . 699*ROE - 5.48
Plugging in all of the Rays data would predict 4.87 runs per game. That jumps us alot closer to the 5.11. Adding in all of the baserunning data closes almost half the original gap of .45 between their actual runs and predicted runs.
I also tried breaking down OBP & SLG into cases of none on and runners on base (ROB). Here is the equation:
R/G = 7.83*ROBSLG + 9.26*ROBOBP + 3.66NONESLG + 8.53*NONEOBP - 6.12
Notice how SLG is twice as important with runners on than with none on. With none on, the Rays have an OBP & SLG of .322 & .396. With ROB, they have .357 & .429. Plugging all that in to the equation predicts 4.74 runs per game. That is .08 higher than the very first equation reported (4.65). So if we combined that with the findings from baserunning, we would probably get something over 4.87 and we have a good idea why the Rays are scoring so many runs this year.
R/G = 11.595*SLG + 16.04*OBP - 5.52
The Rays have a .338 OBP & a .410 SLG. That predicts 4.66 runs per game yet they are actually scoring 5.11. That is .45 more than expected and the next highest positive differential is about .30 for the Padres
I then used an equation which included GDPs, SBs and CSs per game. It was
R/G = -0.0556*GDP - 0.182*CS + 0.105*SB + 11.19*OBP + 16.34*SLG - 5.43
That predicted that the Rays would score 4.71 runs per game, still well below their rate of 5.11. Then I added in 4 other baserunning variables: the % of runners on first who make it to third on a single (13%), bases taken, like on fly balls and wild pitches (BT), reaching on errors (ROE), and outs on base, like getting thrown out trying for an extra base (data from Baseball Reference). The last three were all per game.
Here is the equation:
R/G = -.025*GDP - .347*CS + .083*SB + 11*SLG + 14.59*OBP + 1.17*13% + .359*BT - .426*OOB + . 699*ROE - 5.48
Plugging in all of the Rays data would predict 4.87 runs per game. That jumps us alot closer to the 5.11. Adding in all of the baserunning data closes almost half the original gap of .45 between their actual runs and predicted runs.
I also tried breaking down OBP & SLG into cases of none on and runners on base (ROB). Here is the equation:
R/G = 7.83*ROBSLG + 9.26*ROBOBP + 3.66NONESLG + 8.53*NONEOBP - 6.12
Notice how SLG is twice as important with runners on than with none on. With none on, the Rays have an OBP & SLG of .322 & .396. With ROB, they have .357 & .429. Plugging all that in to the equation predicts 4.74 runs per game. That is .08 higher than the very first equation reported (4.65). So if we combined that with the findings from baserunning, we would probably get something over 4.87 and we have a good idea why the Rays are scoring so many runs this year.
Wednesday, September 8, 2010
Could A Person Watch Every Game In A League For A Whole Season?
With all the technology we have, it seems like it could be possible. Maybe a good writer would be willing to try this or someone who works at ESPN. In the AL, there are normally, at most, 7 games in a day. If you do alot of fast forwarding, you might be able to watch each game in an hour. So it would be like a full time job. You could blog abot it every day. Maybe even turn it into a book.
No one has ever done this before. A good writer might be able to tell a good story or be able to bring something new to baseball analysis. It could drive someone crazy, too. Then there are the inter-league games. If you were doing the AL, you would have to watch 14 games per day. I don't think I would be willing to try it and even if I could take a leave of absense from my teaching job, it would be tough.
When it comes to awards and all-star voting, in a way, no one is really qualified to vote, since no one sees every game. But maybe now it would be different. Maybe several writers could do this and then it would be fun to hear all their different viewpoints.
No one has ever done this before. A good writer might be able to tell a good story or be able to bring something new to baseball analysis. It could drive someone crazy, too. Then there are the inter-league games. If you were doing the AL, you would have to watch 14 games per day. I don't think I would be willing to try it and even if I could take a leave of absense from my teaching job, it would be tough.
When it comes to awards and all-star voting, in a way, no one is really qualified to vote, since no one sees every game. But maybe now it would be different. Maybe several writers could do this and then it would be fun to hear all their different viewpoints.
Sunday, September 5, 2010
Lost RBIs Found, Part 2
This another guest post by Tom Ruane. The first part was Lost RBIs Of Ruth, Gehrig, Others Discovered
Nearly two weeks ago, I sent out a note on several games from 1920 to 1949 in which teams scored at least three runs without an official RBI. As I pointed out at the time, some of these seemed to be legitimate cases where no RBI should have been credited, but most appeared to be oversights on the part of the official scorer. Simply put, they forgot to fill in the RBIs on the sheets they submitted. In addition to providing information on these games, I asked for help locating detailed accounts of some of these games.
I would like to thank Mark Pankin, Ron Antonucci, Keith Carlson and Ron Selter for their help in locating accounts of all of the games on the "missing" list. I would also like to apologize in advance if I forgot to thank anyone.
I also decided to extend my search for missing RBIs by looking at all games where a team scored two runs without being credited with an RBIs. As expected, many of these were cases where both runs scored on errors, wild pitches, steals of home and so on. Others reflect a different interpretation of what an RBI was (and I will have more to say on this subject in a later post). And other cases are once again games in which it appears that the official scorer forgot about RBIs.
So here is an updated version of my earlier list, this time including those two runs games. Once again, the number before the date is the number of runs scored by the team in the game.


* - only source was newspaper box score
+ - missing a detailed account of the game
As you no doubt noticed, extending the search in this manner added a handful of new "missing" games:
1920-9-19(2) WS1 @ DET
1921-6-26 CIN @ SLN
1921-7-24 SLA V BOS
1922-6-27(1) BOS @ PHA
1923-5-27 SLA V CLE
1926-5-1 SLA V DET
1927-9-30 PHI @ BSN
Nearly two weeks ago, I sent out a note on several games from 1920 to 1949 in which teams scored at least three runs without an official RBI. As I pointed out at the time, some of these seemed to be legitimate cases where no RBI should have been credited, but most appeared to be oversights on the part of the official scorer. Simply put, they forgot to fill in the RBIs on the sheets they submitted. In addition to providing information on these games, I asked for help locating detailed accounts of some of these games.
I would like to thank Mark Pankin, Ron Antonucci, Keith Carlson and Ron Selter for their help in locating accounts of all of the games on the "missing" list. I would also like to apologize in advance if I forgot to thank anyone.
I also decided to extend my search for missing RBIs by looking at all games where a team scored two runs without being credited with an RBIs. As expected, many of these were cases where both runs scored on errors, wild pitches, steals of home and so on. Others reflect a different interpretation of what an RBI was (and I will have more to say on this subject in a later post). And other cases are once again games in which it appears that the official scorer forgot about RBIs.
So here is an updated version of my earlier list, this time including those two runs games. Once again, the number before the date is the number of runs scored by the team in the game.

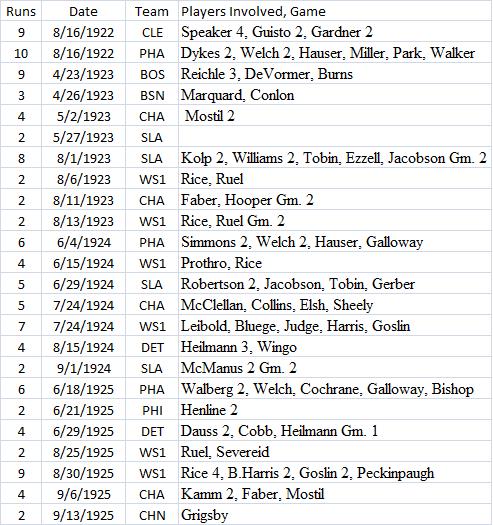


* - only source was newspaper box score
+ - missing a detailed account of the game
As you no doubt noticed, extending the search in this manner added a handful of new "missing" games:
1920-9-19(2) WS1 @ DET
1921-6-26 CIN @ SLN
1921-7-24 SLA V BOS
1922-6-27(1) BOS @ PHA
1923-5-27 SLA V CLE
1926-5-1 SLA V DET
1927-9-30 PHI @ BSN
Wednesday, September 1, 2010
Update on Blue Jays and Astros Offenses
My first post on this was Astros Offense On Record Setting Low Pace. Right now their OPS is .663 and the league average is .727. So .663/.72 = .912, giving them a relative OPS of about 91. That would put them in the bottom 25 since 1993.
The Astros have an OPS+ of 78 according to Baseball Reference. It takes park effects into effect as well as the league average (it is calculated a little differently than above). That is last in the NL this year. The Pirates are next lowest at 81. The lowest team OPS+ I found going all the way back to 1920 was 69 for the 1920 Philadelphia A's. But the Mariners are even lower now than the Astros with a 77. The last time any team finished a season below 80 was in 2004, the Expos (78) and the Diamondbacks (77).
The Blue Jays have an isolated power (ISO) of .205 since their SLG is .455 and their AVG is .250. That is about the same as the all-time record of .205 by the 1997 Mariners. Relative to the league average, it would be the 6th highest since 1900, at 139 (.205/.148 = 1.39). The league ISO in the AL this year is .148. The 1927 Yankees are the highest in relative ISO at 153. The Jays ISO is .233 at home and .180 on the road.
My first post on this was Blue Jays On Record Power Pace.
The Astros have an OPS+ of 78 according to Baseball Reference. It takes park effects into effect as well as the league average (it is calculated a little differently than above). That is last in the NL this year. The Pirates are next lowest at 81. The lowest team OPS+ I found going all the way back to 1920 was 69 for the 1920 Philadelphia A's. But the Mariners are even lower now than the Astros with a 77. The last time any team finished a season below 80 was in 2004, the Expos (78) and the Diamondbacks (77).
The Blue Jays have an isolated power (ISO) of .205 since their SLG is .455 and their AVG is .250. That is about the same as the all-time record of .205 by the 1997 Mariners. Relative to the league average, it would be the 6th highest since 1900, at 139 (.205/.148 = 1.39). The league ISO in the AL this year is .148. The 1927 Yankees are the highest in relative ISO at 153. The Jays ISO is .233 at home and .180 on the road.
My first post on this was Blue Jays On Record Power Pace.
Sunday, August 29, 2010
Did Earl Averill Have A Tremendous Walk-To-Strikeout Ratio?
Joe Posnanski recently wrote at his blog the following:
I wrote the following comment there:
So it is not surprising that we might see a guy like Averill and, not knowing the context, be impressed. Over the past five years in MLB, there have been 80,089 walks and 160,963 strikeouts. That means .5 walks for every HR. Averill's ratio was three times that. But there just were not that many strikeouts when he played. How did he compare to other players? The table below shows the top 25 in walk-to-strikeout ratio from 1929-1940 with 2500+ PAs.

Averill is not in the top 25. He was 60th out of 152 players. Yes, those numbers are correct for Sewell. One year his ratio was 16-1. Another year it was 17.75-1. If I only look at guys with 5000+ PAs, Averill is in the top 25, as the table below shows. But, there were only 38 such players.

Now he was a HR hitter, with 238 in his career. They sometimes strikeout alot. So I looked at all players from 1920-1950 who hit 200+ HRs. Here are the leaders. He is there, but there were only a total of 29 guys in the group.

Finally, there were not many big strikeout pitchers in those days. The two lists below show the leaders in both leagues from 1929-40. That guy named Feller sure changed things. Averill did not face him much since he played most of his career for the Indians.
1929--LEFTY GROVE 170
1930--LEFTY GROVE 209
1931--LEFTY GROVE 175
1932--RED RUFFING 190
1933--LEFTY GOMEZ 163
1934--LEFTY GOMEZ 158
1935--TOMMY BRIDGES 163
1936--TOMMY BRIDGES 175
1937--LEFTY GOMEZ 194
1938--BOB FELLER 240
1939--BOB FELLER 246
1940--BOB FELLER 261
1929--PAT MALONE 166
1930--WILD BILL HALLAHAN 177
1931--WILD BILL HALLAHAN 159
1932--DIZZY DEAN 191
1933--DIZZY DEAN 199
1934--DIZZY DEAN 195
1935--DIZZY DEAN 190
1936--VAN LINGLE MUNGO 238
1937--CARL HUBBELL 159
1938--CLAY BRYANT 135
1939--CLAUDE PASSEAU 137
--BUCKY WALTERS 137
1940--KIRBY HIGBE 137
"As you have already seen, the only two Hall of Famers who hit home runs in their first at-bats — Averill and Wilhelm — were not famous for home runs. Averill did have three 30-homer seasons, but it was his all-around play, including a tremendous walk-to-strikeout [ratio] (774 walks to 518 Ks) and superior defense, that made him a terrific player."See A Homer His First Time Up!
I wrote the following comment there:
"That walk-to-strikeout ratio is perhaps not so tremendous. It is 1.496. But using the Lee Sinins Complete Baseball Encyclopedia, I found that the average player (non-pitchers) in Averill’s era had a ratio of 692 to 523, which is 1.32. That means that Averill was about 13% better than average since 1.496/1.32 = 1.13.Baseball history often surprises us (well, it surprises me alot). For example, I discovered that Fritz Maisel, in 1914, had perhaps the greatest base stealing season before Maury Wills in 1962 (taking steals, caught stealing, times reaching first base and the league average into account). I had never heard of him before. See What Were The Best Relative Base Stealing Seasons? There have been many times I started calling up lists of leaders in stats where I start to see names for the first time.
Imagine that the average player hits 15 HRs in a full season. If you hit 13% more, you hit about 17. This is not tremendous."
So it is not surprising that we might see a guy like Averill and, not knowing the context, be impressed. Over the past five years in MLB, there have been 80,089 walks and 160,963 strikeouts. That means .5 walks for every HR. Averill's ratio was three times that. But there just were not that many strikeouts when he played. How did he compare to other players? The table below shows the top 25 in walk-to-strikeout ratio from 1929-1940 with 2500+ PAs.

Averill is not in the top 25. He was 60th out of 152 players. Yes, those numbers are correct for Sewell. One year his ratio was 16-1. Another year it was 17.75-1. If I only look at guys with 5000+ PAs, Averill is in the top 25, as the table below shows. But, there were only 38 such players.

Now he was a HR hitter, with 238 in his career. They sometimes strikeout alot. So I looked at all players from 1920-1950 who hit 200+ HRs. Here are the leaders. He is there, but there were only a total of 29 guys in the group.

Finally, there were not many big strikeout pitchers in those days. The two lists below show the leaders in both leagues from 1929-40. That guy named Feller sure changed things. Averill did not face him much since he played most of his career for the Indians.
1929--LEFTY GROVE 170
1930--LEFTY GROVE 209
1931--LEFTY GROVE 175
1932--RED RUFFING 190
1933--LEFTY GOMEZ 163
1934--LEFTY GOMEZ 158
1935--TOMMY BRIDGES 163
1936--TOMMY BRIDGES 175
1937--LEFTY GOMEZ 194
1938--BOB FELLER 240
1939--BOB FELLER 246
1940--BOB FELLER 261
1929--PAT MALONE 166
1930--WILD BILL HALLAHAN 177
1931--WILD BILL HALLAHAN 159
1932--DIZZY DEAN 191
1933--DIZZY DEAN 199
1934--DIZZY DEAN 195
1935--DIZZY DEAN 190
1936--VAN LINGLE MUNGO 238
1937--CARL HUBBELL 159
1938--CLAY BRYANT 135
1939--CLAUDE PASSEAU 137
--BUCKY WALTERS 137
1940--KIRBY HIGBE 137
Thursday, August 26, 2010
Tim Linceum's Falling Strikeout-To-Hit Ratio
Here are his ratios each month this year starting with April
43/22 = 1.95
40/33 = 1.21
34/33 = 1.03
35/42 = .833
21/28 = .75 (after Friday's start it is 27/33 = .818)
Last year it was
261/168 = 1.55
In 2008 it was
265/182 = 1.46
For all of this year it is 1.09 = 173/158
Th NL average in 2010 is 14751/17652 =.834
I don't know how important this ratio is. Alot of young flame throwers see their strikeouts fall as they get older.
Tim Kawakami of the Mercury News has a possible explanation. Go to The math on Tim Lincecum: Lots of pitches, lots of innings, not enough MPH (lately).
43/22 = 1.95
40/33 = 1.21
34/33 = 1.03
35/42 = .833
21/28 = .75 (after Friday's start it is 27/33 = .818)
Last year it was
261/168 = 1.55
In 2008 it was
265/182 = 1.46
For all of this year it is 1.09 = 173/158
Th NL average in 2010 is 14751/17652 =.834
I don't know how important this ratio is. Alot of young flame throwers see their strikeouts fall as they get older.
Tim Kawakami of the Mercury News has a possible explanation. Go to The math on Tim Lincecum: Lots of pitches, lots of innings, not enough MPH (lately).
Tuesday, August 24, 2010
Lost RBIs Of Ruth, Gehrig, Others Discovered
This is a guest post by Tom Ruane
Prior to the SABR convention, someone pointed out to us that our box score of the second game of the June 1, 1930, double-header between the Giants and the Braves showed the visiting Giants scoring 16 runs without a single RBI. Our box score reflects the official version of the game. According to both our play-by-play account and numerous newspaper box scores, the Giants should have had 14 RBIs.
I figured that there were probably several other games like this from 1920 to 1949. So I wrote a program to identify all the games where a team scored three runs or more without being credited with an RBI. My program found 71 games. Some of these games were not official errors. For example, on July 2, 1948, the Cubs scored five runs and all of these runs were scored as a result of a wild pitch, balk and errors.
And just so I won't being accused of completely burying the lead, the changes suggested below would have the following effect on the 1928 AL RBI leadership:
Before:
1 Babe Ruth 142
1 Lou Gehrig 142
3 Bob Meusel 113
4 Heinie Manush 108
After:
1 Babe Ruth 144
2 Lou Gehrig 143
3 Bob Meusel 116
4 Harry Heilmann 109
4 Heinie Manush 109
4 Al Simmons 109
But more on this later.
Here are the games I found that are (or might be) official errors along with the RBIs I think are missing. The number before the date is the number of runs scored by the team in the game.


x - noticed when fixing the other team's RBIs
* - only source was newspaper box score
+ - missing a detailed account of the game
Among other things, these updates could have the following effect:
1920 - George Sisler moves from a tie into 2nd place all by himself. Jacobson drops into 3rd place.
1922 - Tillie Walker's added RBI gives him an even 100 for the year.
1924 - Goose Goslin's league-leading total becomes 130. Harry Heilmann moves ahead of Hauser into 4th place with 117.
1926 - George Burns moves from a tie into 2nd place all by himself. Lazzeri drops into 3rd place.
1927 - Paul Waner's league-leading total becomes 132.
1928 - As mentioned above, Babe Ruth moves from a tie for the league leadership into first place with 144 RBIs. Lou Gehrig's total increases to 143 RBIs but he still drops into second place. Al Simmons and Harry Heilmann move into a fourth-place tie with Heinie Manush with 109 RBIs. All three have their totals increase, but Simmons and Heilmann's increase by two and Manush's only increases by one.
I said "could" have the following effect because this is by no means the last word on RBIs for this period. I suspect there are several hundred remaining errors in the RBI data from this period and expect these numbers to continue to change as more research is done in this area.
To highlight this last point, I thought it might be interesting to take a closer look at Gehrig and Ruth's RBI totals for 1928. Since this is the only proposed change that might affect a league leader, I went and looked at all of their games that season. Here's what I found.
4-18: Ruth +2 and Gehrig +1. Mentioned above - no RBIs credited to team.
5-10: Gehrig -1. It looks like his SH was put in the RBI column of the dailies.
5-26: Ruth +2. He was not given credit for his RBIs on a ground-out and sacrifice fly.
5-28: Ruth +1. He was not given credit for RBI on bases-loaded walk.
6-28: Gehrig +1 and Ruth -1. Ruth given RBI on Gehrig's sacrifice fly.
8-6: Gehrig +1. He was not given credit for RBI on force-out at second with the bases loaded. The attempt to double-up Gehrig resulted in a throw to an unoccupied base. Two runs scored on the play, but I think Gehrig should have given one RBI.
8-7: Gehrig +1 and Ruth -1. Ruth given credit for one of Gehrig's RBIs in the first inning.
9-9: Gehrig +1. Two errors here. First of all, two RBIs were put in the strikeout column of the dailies. And assuming that the intent was to give him two RBIs in the game, that means he was incorrectly credited with an RBI when he tripled and scored on an error. Either way, Gehrig was credited with no official RBIs and should have had one.
9-16: Gehrig +1. no RBI credited on solo home run.
9-18: newspaper box scores do not credit Gehrig with an RBI in the game, but I can not find a complete enough account of the scoring to make a case for a change.
So what is the net effect of all these changes. Well, they result in 3 additional RBIs for Ruth and 5 for Gehrig. So instead of having Ruth take sole ownership of the RBI title (144-143), it should be Gehrig in the top spot by 147-145. And even if further research supports removing his RBI on 9-18, he would still own the title outright.
One final note on Gehrig's RBI totals: if we adjust his 1928 figure from 142 to 147, that would also change his career mark from 1995 to an even 2000. But there is no reason to think that his totals from other years won't change as well. As a matter of fact, incomplete research from other seasons have him with one less RBI than officially credited in 1926, 1929 and 1938 (giving him an adjusted total of 1997), and I'd be very surprised if there weren't several more changes yet to come.
Finally, a request for help. If anyone has access to a Philadelphia, St. Louis, Cleveland or Detroit library, I would love to have copies of the local game stories for the eight games above marked with a "+". They are:
1923-4-23 BOS @ PHA
1923-8-1(2) SLA @ PHA
1924-6-4 PHA @ CLE
1924-6-29 SLA @ CHA
1926-4-20 SLA @ DET
1926-6-18 PHA @ DET
1926-7-22 SLA @ BOS
1926-8-6 PIT @ BSN
Tom Ruane, a computer programmer in Poughkeepsie, N.Y., is a member of Retrosheet's board of directors. He has published articles in "The Baseball Research Journal" and "By The Numbers." He won SABR's highest honor, the Bob Davids Award, in 2009.
Prior to the SABR convention, someone pointed out to us that our box score of the second game of the June 1, 1930, double-header between the Giants and the Braves showed the visiting Giants scoring 16 runs without a single RBI. Our box score reflects the official version of the game. According to both our play-by-play account and numerous newspaper box scores, the Giants should have had 14 RBIs.
I figured that there were probably several other games like this from 1920 to 1949. So I wrote a program to identify all the games where a team scored three runs or more without being credited with an RBI. My program found 71 games. Some of these games were not official errors. For example, on July 2, 1948, the Cubs scored five runs and all of these runs were scored as a result of a wild pitch, balk and errors.
And just so I won't being accused of completely burying the lead, the changes suggested below would have the following effect on the 1928 AL RBI leadership:
Before:
1 Babe Ruth 142
1 Lou Gehrig 142
3 Bob Meusel 113
4 Heinie Manush 108
After:
1 Babe Ruth 144
2 Lou Gehrig 143
3 Bob Meusel 116
4 Harry Heilmann 109
4 Heinie Manush 109
4 Al Simmons 109
But more on this later.
Here are the games I found that are (or might be) official errors along with the RBIs I think are missing. The number before the date is the number of runs scored by the team in the game.


x - noticed when fixing the other team's RBIs
* - only source was newspaper box score
+ - missing a detailed account of the game
Among other things, these updates could have the following effect:
1920 - George Sisler moves from a tie into 2nd place all by himself. Jacobson drops into 3rd place.
1922 - Tillie Walker's added RBI gives him an even 100 for the year.
1924 - Goose Goslin's league-leading total becomes 130. Harry Heilmann moves ahead of Hauser into 4th place with 117.
1926 - George Burns moves from a tie into 2nd place all by himself. Lazzeri drops into 3rd place.
1927 - Paul Waner's league-leading total becomes 132.
1928 - As mentioned above, Babe Ruth moves from a tie for the league leadership into first place with 144 RBIs. Lou Gehrig's total increases to 143 RBIs but he still drops into second place. Al Simmons and Harry Heilmann move into a fourth-place tie with Heinie Manush with 109 RBIs. All three have their totals increase, but Simmons and Heilmann's increase by two and Manush's only increases by one.
I said "could" have the following effect because this is by no means the last word on RBIs for this period. I suspect there are several hundred remaining errors in the RBI data from this period and expect these numbers to continue to change as more research is done in this area.
To highlight this last point, I thought it might be interesting to take a closer look at Gehrig and Ruth's RBI totals for 1928. Since this is the only proposed change that might affect a league leader, I went and looked at all of their games that season. Here's what I found.
4-18: Ruth +2 and Gehrig +1. Mentioned above - no RBIs credited to team.
5-10: Gehrig -1. It looks like his SH was put in the RBI column of the dailies.
5-26: Ruth +2. He was not given credit for his RBIs on a ground-out and sacrifice fly.
5-28: Ruth +1. He was not given credit for RBI on bases-loaded walk.
6-28: Gehrig +1 and Ruth -1. Ruth given RBI on Gehrig's sacrifice fly.
8-6: Gehrig +1. He was not given credit for RBI on force-out at second with the bases loaded. The attempt to double-up Gehrig resulted in a throw to an unoccupied base. Two runs scored on the play, but I think Gehrig should have given one RBI.
8-7: Gehrig +1 and Ruth -1. Ruth given credit for one of Gehrig's RBIs in the first inning.
9-9: Gehrig +1. Two errors here. First of all, two RBIs were put in the strikeout column of the dailies. And assuming that the intent was to give him two RBIs in the game, that means he was incorrectly credited with an RBI when he tripled and scored on an error. Either way, Gehrig was credited with no official RBIs and should have had one.
9-16: Gehrig +1. no RBI credited on solo home run.
9-18: newspaper box scores do not credit Gehrig with an RBI in the game, but I can not find a complete enough account of the scoring to make a case for a change.
So what is the net effect of all these changes. Well, they result in 3 additional RBIs for Ruth and 5 for Gehrig. So instead of having Ruth take sole ownership of the RBI title (144-143), it should be Gehrig in the top spot by 147-145. And even if further research supports removing his RBI on 9-18, he would still own the title outright.
One final note on Gehrig's RBI totals: if we adjust his 1928 figure from 142 to 147, that would also change his career mark from 1995 to an even 2000. But there is no reason to think that his totals from other years won't change as well. As a matter of fact, incomplete research from other seasons have him with one less RBI than officially credited in 1926, 1929 and 1938 (giving him an adjusted total of 1997), and I'd be very surprised if there weren't several more changes yet to come.
Finally, a request for help. If anyone has access to a Philadelphia, St. Louis, Cleveland or Detroit library, I would love to have copies of the local game stories for the eight games above marked with a "+". They are:
1923-4-23 BOS @ PHA
1923-8-1(2) SLA @ PHA
1924-6-4 PHA @ CLE
1924-6-29 SLA @ CHA
1926-4-20 SLA @ DET
1926-6-18 PHA @ DET
1926-7-22 SLA @ BOS
1926-8-6 PIT @ BSN
Tom Ruane, a computer programmer in Poughkeepsie, N.Y., is a member of Retrosheet's board of directors. He has published articles in "The Baseball Research Journal" and "By The Numbers." He won SABR's highest honor, the Bob Davids Award, in 2009.
Sunday, August 22, 2010
Lou Gehrig and Lou Gehrig's Disease
This is a guest post by Doctor Steven A. King
For anyone tempted to read the original paper on which this story was based thinking that it might discuss Lou, you will be disappointed. Not only isn't Lou mentioned neither is baseball.
(Editor's note: The New York Times article by Alan Schwarz can be read at Lou Gehrig may not have really had Lou Gehrig's disease: Study shows concussions, brain trauma can mimic amyotrophic lateral sclerosis)
The three cases for which the symptoms of Lou Gehrig's disease are attributed to head trauma include 2 pro football players and a boxer.
It's also worth noting that the case histories of these three do not match Lou's at all. Two didn't develop the physical symptoms of their illness until they were in their mid-60's and the third when he was age 47 despite participating in sports associated with much more head trauma than baseball. It's also worth noting that two of the three developed marked cognitive impairment, i.e, inability to think, which preceded the onset of the physical problems and the third developed marked depression with outbursts of anger as the physical symptoms were appearing. As far, as I know none of this is anything close to what Lou experienced.
All three of the cases in the original paper suffered from slurred speech within six months of the onset of their symptoms and two of them including the one who developed his symptoms at age 47 also had marked impairment in walking within that time period. There is no evidence of either of these when Lou gave his famous "Luckiest Man Speech" and as most people believe his symptoms certainly began before the six months preceding it, these are two more significant things that do not apply to him.
I should note that some of the information in the article regarding participation in sports in two of these cases is quite unusual. Although SABR is for those of us enthralled by baseball I assume many of us are also interested in other sports and I would be interested in anyone's input as to the possible validity of the following information:
1. One of the cases is described as a pro football player who retired at age 36 but only played three years of pro ball. Has anyone ever heard of such a strange career?
2. The boxer is reported to have retired at age 22 after boxing professionally for 10 years which obviously means he would have had to start at age 12. Does anyone know of any boxers who began their pro careers at such a young age?
Dr. King is a specialist in pain medicine in New York City. He also trained in neuropsychiatry early in his career at a major research center on the behavioral aspects of head trauma.
Saturday, August 21, 2010
How Well Did Roger Clemens Age?
I wrote several posts on this back in February 2008. Since he has been indicted, I guess this might be relevant again. My idea was to see if he performed better as he aged and if he did, was it unusual. My take on it was that although some of his "old-age" performances were unually good, there were some other pitchers who show similar late-career improvements. Here are links to all of those posts:
How Well Has Roger Clemens Aged?
How Well Has Roger Clemens Aged? (Part 2)
How Well Has Roger Clemens Aged? (Part 3)
How Well Has Roger Clemens Aged? (Part 4)
How Well Has Roger Clemens Aged? (Part 5)
How Well Has Roger Clemens Aged? (Part 6)
I also wrote a couple of articles called "Did Roger Clemens Have the Best Age-Adjusted Season Ever in 2005?" (parts 1 and 2) a couple of years ago. You can read them here and here. Again, the evidence was mixed and it is not clear anything unusual happened then.
How Well Has Roger Clemens Aged?
How Well Has Roger Clemens Aged? (Part 2)
How Well Has Roger Clemens Aged? (Part 3)
How Well Has Roger Clemens Aged? (Part 4)
How Well Has Roger Clemens Aged? (Part 5)
How Well Has Roger Clemens Aged? (Part 6)
I also wrote a couple of articles called "Did Roger Clemens Have the Best Age-Adjusted Season Ever in 2005?" (parts 1 and 2) a couple of years ago. You can read them here and here. Again, the evidence was mixed and it is not clear anything unusual happened then.
Thursday, August 19, 2010
Batting Average On Balls In Play Over Time
I used data from Baseball Reference and broke things down into the two leagues from 1901-2010. Balls in play (BIP) = BFP - HR - SO - BB - HBP. Here is the graph for the AL. Hits on BIP is H - HR.

I don't know why it has changed over time and I am not even sure if it is important. But I was curious to see what it was. Now the NL, which has a similar pattern.

The next graph shows the difference between BABIP and overall AVG for the AL, year-by-year. Again, I don't know if it is important or why it changes.

Now for the NL.

A few years ago I ran a regression using league-wide data for the AL from 1920-2002. BABIP was the dependent variable and the frequency of HRs, SOs, and BBs were the independent variables. The equation was
BABIP = .338 + 2.19*HR - .467*SO - .48*BB
T-values
HR 5.28
SO -56.1
BB - 2.89
So it looks like all the variables were significant. The r-squared was .287 and the standard error of the regression .0097. So it seems like when HR frequency rises, BABIP also rises. Maybe this means that balls are being hit harder, so they are harder to catch or it is just a general lack of good pitching. If SO rate rises, BABIP falls. If it is harder to make contact, it might be harder to make solid contanct. But if BB rate rises, BABIP again falls. Maybe it means that there are more pitches outside the strike zone, making it harder to get good wood on the ball.

I don't know why it has changed over time and I am not even sure if it is important. But I was curious to see what it was. Now the NL, which has a similar pattern.

The next graph shows the difference between BABIP and overall AVG for the AL, year-by-year. Again, I don't know if it is important or why it changes.

Now for the NL.

A few years ago I ran a regression using league-wide data for the AL from 1920-2002. BABIP was the dependent variable and the frequency of HRs, SOs, and BBs were the independent variables. The equation was
BABIP = .338 + 2.19*HR - .467*SO - .48*BB
T-values
HR 5.28
SO -56.1
BB - 2.89
So it looks like all the variables were significant. The r-squared was .287 and the standard error of the regression .0097. So it seems like when HR frequency rises, BABIP also rises. Maybe this means that balls are being hit harder, so they are harder to catch or it is just a general lack of good pitching. If SO rate rises, BABIP falls. If it is harder to make contact, it might be harder to make solid contanct. But if BB rate rises, BABIP again falls. Maybe it means that there are more pitches outside the strike zone, making it harder to get good wood on the ball.
Tuesday, August 17, 2010
Remembering a Great Team: The 1963-67 White Sox
I wrote this a few years ago for the Chicago Sports Review. I thought I would post it again since Rob Neyer just had a blog entry titled White Sox by 'eras,' 1901-2010. Here is my original article. It corresponds to what Neyer calles the "The Joe Horlen Era."
The 1963-67 White Sox were an outstanding team that deserves to be remembered. Although they did not win any pennants in this time, these Sox were the first team in the twentieth century to have the best winning percentage over a five year period without finishing first in their league in even one season. Of course, this was back when there were no divisions and the first place team automatically made it to the World Series. Here are the top 10 teams over this period:

The Sox did not just have a good record, they also had a very good run differential. The Sox outscored their opponents by 469 runs, second only to the Twins’ 561. But if we use what Bill James calls the “Pythagorean winning percentage,” the Sox almost pull even with the Twins. You square runs scored then divide that by runs scored squared plus runs allowed squared. The Twins come out at .584 while the Sox come out at .582 (meaning the Sox may have been a bit unlucky).
The Sox were only serious contenders in two of these five seasons. Although they finished in second in 1963 with 94 wins, they finished 10.5 games behind the Yankees. Their last day in first was June 14th and by Sept. 1, they were 12 games out. In 1965, the Sox finished 7 games behind the Twins, but their last day in first was June 28th and by Sept. 1 they were 7.5 games out. Then on the 15th they were 10 games out. In 1966, the Sox finished 4th, 15 games out.
The two close calls were the disappointing, if not heart breaking, 1964 and 1967 seasons. In 1964, the Sox finished only 1 game behind the Yankees with 98 wins, a total which would have been enough to win the pennant in both 1966 and 1967. At the end of the day on August 20th, the Sox were in first place, a half a game ahead of the Orioles and 4.5 ahead of the Yankees after sweeping them four straight in Chicago. But the Sox played no more games against New York that year. So they could not stop the Yankee juggernaut which went 30-13 from then on. The Sox, although they won their last nine games of the season, only went 23-17 after this point Their last day in sole possession of first was Sept. 9th and they were eliminated on the next to last day of the season.
1967 might be even more disappointing. At the close of play on Sept. 26, the Sox were 89-68, one game behind the Twins who were 91-69. The Sox unfortunately went on to lose a double header to last place Kansas City by scores of 5-2 and 4-0. Then they got swept by 6th place Washington by scores of 1-0, 4-0, and 4-3. They were actually eliminated on Sept. 29th in that first loss to the Senators.
The hallmark of the Sox during these years was the pitching staff. The two big starters, who were there for the whole period, were Gary Peters and Joe Horlen. Peters went 77-49 with a 2.49 ERA. Horlen was 66-49 with a 2.42 ERA. Peters was the 1963 Rookie of the Year and led the AL in ERA twice. Horlen led once. Those ERAs were certainly helped by pitching in Comiskey Park, which allowed about 14% fewer runs than average. But even a more sophisticated stat called RSAA or runs saved above average, which takes park factors into account, shows that Sox pitchers were outstanding in this period. Here are the leaders for both leagues:
Sandy Koufax 173
Juan Marichal 168
Jim Bunning 131
Jim Maloney 118
Bob Gibson 102
Gary Peters 96
Joe Horlen 86
Hoyt Wilhelm 85
Horlen and Peters are joined by ace reliever and knuckleball artist, Hall-of-Famer Hoyt Wilhelm. He saved 86 games while compiling a 1.95 ERA. Other standout pitchers include Juan Pizarro who went 16-8 in 1963 with a 2.39 ERA and 19-8 in 1964 with a 2.56 ERA. Tommy John won 38 games from 1965-67 with an ERA of 2.72. Reliever Eddie Fisher was 15-7 in 1965 with 24 saves and a 2.40 ERA, good enough for second in the league. In four of the five years, the Sox led the AL in ERA adjusted for park differences, twice being 27% better than average. No other team reached 27% in the whole decade of the 1960s, not even the Koufax led Dodgers, who only topped 20% once (it was 26% better than average).
Despite the great staff, no Sox pitcher won the Cy Young award. One reason is that only one award was given for both leagues up through 1966. With the great Koufax winning three of the four awards from 1963-66, it was tough for anyone else. The 1967 AL award probably should have gone to Horlen, who was 19-7 with a 2.08 ERA in 258 innings. But it went instead to Jim Lonborg of the pennant winning Red Sox who went 22-9 with a 3.16 ERA in 273 innings. Although Horlen pitched in a more favorable park, he still beat Lonborg in RSAA, 25-18. Bill James gives Horlen 23 Win Shares to Lonborg’s 19. Even with the stats in Horlen’s favor, in the mind of the voters, Lonborg’s being the one who made 20 wins, and for a pennant winner, must have been decisive. Horlen got two votes, Lonborg 18.
The Sox had good fielders helped the pitching staff prevent runs. Center fielder Jim Landis, one of the few veterans left from the pennant winning team in 1959, won Gold Gloves in both 1963 and 1964 (second baseman Nellie Fox was there for just 1963 and Luis Aparicio had been traded after the 1962 season). Rookie of the Year Tommie Agee took one in 1966. Ken Berry, who played all the OF positions full-time from 1965-67, got one, but not until 1970. But there were other fine fielders. Shortstop Ron Hansen was the best fielder in both 1963 and 64, according the stat guru Bill James’ “Win Shares” method. Tommie Agee was the best twice, Ken Berry was second once and another outfielder, Mike Hershberger, was third once.
The weak spot for the Sox was their hitting. Over this period, their team OPS (on-base percentage + slugging percentage) was about 3% below average, after taking park effects into account. There were not too many good hitting seasons, but the best Sox hitters during this time were probably third baseman Pete Ward and outfielder Floyd Robinson. Ward hit .295 with 22 HRs in 1963 and hit .282 with 23 HRs in 1964. His career was hurt by injuries after that. He did finish 9th in “offensive winning percentage” or OWP in 1964 with .666 (its another stat from Bill James). He just missed the top 10 in 1963. Robinson was the only Sox .300 hitter with .301 in 1964, when he was 8th in the AL with a .667 OWP. Don Buford was 10th in OWP in 1965 at .640 while batting .283 (actually very good for the 60s in Comiskey Park).
Other notable hitting performances include Bill “Moose” Skowron who hit 18 HRs and batted .274 in 1965. Hansen’s 20 HRs and .261 AVG in 1964 were pretty good for a SS. Agee batted .273 in 1966 with 22 HRs and 44 SBs. Catcher John Romano had fine seasons in 1965 and 1966, hitting 18 and 15 HRs. Although he only batted .242 and .231, his good on-base percentages of .355 and .344 pushed his OWP above .600 both years, which is great for a catcher. The Sox were third in SBs in MLB this period with 466. But they were thrown out 260 times, for 63% success rate, just barely above the average rate of 61.8%. So they were not exactly the “go-go” Sox.Buford stole 51 bases in 1966 for the best Sox total of the period. Agee’s 44 was second.
It could be tempting to look at the weak offense as the reason for missing out on pennants in both 1964 and 1967, especially considering that the Sox once had good hitters like Norm Cash, Johnny Callison, Don Mincher and Earl Battey but traded them away. Cash had over a .600 OWP in both those years while hitting over 20 HRs. McCraw was .505 and .474. Callison went over .600 in 1964 with 30 HRs and 100 RBIs. After Robinson, that was much better than any other Sox outfielder. The Sox could be blamed for trading those young prospects for quality, but aging veterans after 1959 in hopes of getting back to back pennants. This may not be fair. Let’s see why.
Cash was traded to the Indians and this brought Minnie Minoso back to the south side. None of the other players the Sox got in that one amounted to much or were traded for anyone who played key roles from 1963-67. But losing Cash hurt in the long run and there was no short term gain, as the Sox, of course, did not repeat in 1960.
Callison was traded for Gene Freese, who had a solid year for the Sox in 1960. That was all he did. But he was later traded for Pizarro, who turned in some good years (Pizarro was later traded for Wilbur Wood, who turned in a solid year in 1967). Battey was traded for slugger Roy Sievers, who hit over 20 HRs and had over 90 RBIs for two seasons. He was later traded for Buzhardt, who pitched alot for the Sox but was just a journeyman.
Mincher would have been a big help. A first baseman, his OWP in 1967 went over .700 playing almost full-time for the Angels. He hit 200 career HRs with a very solid .348 on-base percentage. On balance, these trades hurt. But one of the bad trades did lead to Pizarro and the Sox turned some good trades, too. The Sox got Agee, Romano, and Tommy John before the 1965 season for Landis and Hershberger, players who did not do much after that. Another big trade was when the Sox got Hansen, Wilhelm, Dave Nicholson and Ward from Baltimore for Aparicio and Al Smith in January, 1963. So we can’t blame trades since there some good ones and some bad ones.
The following players received votes for the AL MVP award: 1963-Peters finished 8th in the voting and Ward 9th. 1964-Ward 6th, Peters 7th, Robinson 15th and Hansen 16th. 1965-Fisher, 4th. 1966-Agee, 8th. 1967-Horlen, 4th (ahead of Lonborg, who was 6th!!), Peters, 8th, Hansen, 14th (who was also 17th another year). Sure looks like Hansen should be remembered as one of the top AL players of the mid-60s.
To round things out, here are the players and pitchers who were on the Sox for all five years: Peters, Horlen, utility infielder Al Weis, Hansen, Ward, part-time catcher J.C. Martin, first baseman Tommy McCraw, infielder Don Buford, and pitcher John Buzhardt. Hansen was the starting SS for all but 1966 when he was hurt. Ward was the regular 3B man except for 1966 when he only played half the season. The following pitchers and players were there for four seasons: Robinson, pitchers Fisher and Buzhardt. Plus who could forget pinch hitting specialist Smoky Burgess, who did have 5ABs in 1964. These players were the core of a great team.
The 1963-67 White Sox were an outstanding team that deserves to be remembered. Although they did not win any pennants in this time, these Sox were the first team in the twentieth century to have the best winning percentage over a five year period without finishing first in their league in even one season. Of course, this was back when there were no divisions and the first place team automatically made it to the World Series. Here are the top 10 teams over this period:

The Sox did not just have a good record, they also had a very good run differential. The Sox outscored their opponents by 469 runs, second only to the Twins’ 561. But if we use what Bill James calls the “Pythagorean winning percentage,” the Sox almost pull even with the Twins. You square runs scored then divide that by runs scored squared plus runs allowed squared. The Twins come out at .584 while the Sox come out at .582 (meaning the Sox may have been a bit unlucky).
The Sox were only serious contenders in two of these five seasons. Although they finished in second in 1963 with 94 wins, they finished 10.5 games behind the Yankees. Their last day in first was June 14th and by Sept. 1, they were 12 games out. In 1965, the Sox finished 7 games behind the Twins, but their last day in first was June 28th and by Sept. 1 they were 7.5 games out. Then on the 15th they were 10 games out. In 1966, the Sox finished 4th, 15 games out.
The two close calls were the disappointing, if not heart breaking, 1964 and 1967 seasons. In 1964, the Sox finished only 1 game behind the Yankees with 98 wins, a total which would have been enough to win the pennant in both 1966 and 1967. At the end of the day on August 20th, the Sox were in first place, a half a game ahead of the Orioles and 4.5 ahead of the Yankees after sweeping them four straight in Chicago. But the Sox played no more games against New York that year. So they could not stop the Yankee juggernaut which went 30-13 from then on. The Sox, although they won their last nine games of the season, only went 23-17 after this point Their last day in sole possession of first was Sept. 9th and they were eliminated on the next to last day of the season.
1967 might be even more disappointing. At the close of play on Sept. 26, the Sox were 89-68, one game behind the Twins who were 91-69. The Sox unfortunately went on to lose a double header to last place Kansas City by scores of 5-2 and 4-0. Then they got swept by 6th place Washington by scores of 1-0, 4-0, and 4-3. They were actually eliminated on Sept. 29th in that first loss to the Senators.
The hallmark of the Sox during these years was the pitching staff. The two big starters, who were there for the whole period, were Gary Peters and Joe Horlen. Peters went 77-49 with a 2.49 ERA. Horlen was 66-49 with a 2.42 ERA. Peters was the 1963 Rookie of the Year and led the AL in ERA twice. Horlen led once. Those ERAs were certainly helped by pitching in Comiskey Park, which allowed about 14% fewer runs than average. But even a more sophisticated stat called RSAA or runs saved above average, which takes park factors into account, shows that Sox pitchers were outstanding in this period. Here are the leaders for both leagues:
Sandy Koufax 173
Juan Marichal 168
Jim Bunning 131
Jim Maloney 118
Bob Gibson 102
Gary Peters 96
Joe Horlen 86
Hoyt Wilhelm 85
Horlen and Peters are joined by ace reliever and knuckleball artist, Hall-of-Famer Hoyt Wilhelm. He saved 86 games while compiling a 1.95 ERA. Other standout pitchers include Juan Pizarro who went 16-8 in 1963 with a 2.39 ERA and 19-8 in 1964 with a 2.56 ERA. Tommy John won 38 games from 1965-67 with an ERA of 2.72. Reliever Eddie Fisher was 15-7 in 1965 with 24 saves and a 2.40 ERA, good enough for second in the league. In four of the five years, the Sox led the AL in ERA adjusted for park differences, twice being 27% better than average. No other team reached 27% in the whole decade of the 1960s, not even the Koufax led Dodgers, who only topped 20% once (it was 26% better than average).
Despite the great staff, no Sox pitcher won the Cy Young award. One reason is that only one award was given for both leagues up through 1966. With the great Koufax winning three of the four awards from 1963-66, it was tough for anyone else. The 1967 AL award probably should have gone to Horlen, who was 19-7 with a 2.08 ERA in 258 innings. But it went instead to Jim Lonborg of the pennant winning Red Sox who went 22-9 with a 3.16 ERA in 273 innings. Although Horlen pitched in a more favorable park, he still beat Lonborg in RSAA, 25-18. Bill James gives Horlen 23 Win Shares to Lonborg’s 19. Even with the stats in Horlen’s favor, in the mind of the voters, Lonborg’s being the one who made 20 wins, and for a pennant winner, must have been decisive. Horlen got two votes, Lonborg 18.
The Sox had good fielders helped the pitching staff prevent runs. Center fielder Jim Landis, one of the few veterans left from the pennant winning team in 1959, won Gold Gloves in both 1963 and 1964 (second baseman Nellie Fox was there for just 1963 and Luis Aparicio had been traded after the 1962 season). Rookie of the Year Tommie Agee took one in 1966. Ken Berry, who played all the OF positions full-time from 1965-67, got one, but not until 1970. But there were other fine fielders. Shortstop Ron Hansen was the best fielder in both 1963 and 64, according the stat guru Bill James’ “Win Shares” method. Tommie Agee was the best twice, Ken Berry was second once and another outfielder, Mike Hershberger, was third once.
The weak spot for the Sox was their hitting. Over this period, their team OPS (on-base percentage + slugging percentage) was about 3% below average, after taking park effects into account. There were not too many good hitting seasons, but the best Sox hitters during this time were probably third baseman Pete Ward and outfielder Floyd Robinson. Ward hit .295 with 22 HRs in 1963 and hit .282 with 23 HRs in 1964. His career was hurt by injuries after that. He did finish 9th in “offensive winning percentage” or OWP in 1964 with .666 (its another stat from Bill James). He just missed the top 10 in 1963. Robinson was the only Sox .300 hitter with .301 in 1964, when he was 8th in the AL with a .667 OWP. Don Buford was 10th in OWP in 1965 at .640 while batting .283 (actually very good for the 60s in Comiskey Park).
Other notable hitting performances include Bill “Moose” Skowron who hit 18 HRs and batted .274 in 1965. Hansen’s 20 HRs and .261 AVG in 1964 were pretty good for a SS. Agee batted .273 in 1966 with 22 HRs and 44 SBs. Catcher John Romano had fine seasons in 1965 and 1966, hitting 18 and 15 HRs. Although he only batted .242 and .231, his good on-base percentages of .355 and .344 pushed his OWP above .600 both years, which is great for a catcher. The Sox were third in SBs in MLB this period with 466. But they were thrown out 260 times, for 63% success rate, just barely above the average rate of 61.8%. So they were not exactly the “go-go” Sox.Buford stole 51 bases in 1966 for the best Sox total of the period. Agee’s 44 was second.
It could be tempting to look at the weak offense as the reason for missing out on pennants in both 1964 and 1967, especially considering that the Sox once had good hitters like Norm Cash, Johnny Callison, Don Mincher and Earl Battey but traded them away. Cash had over a .600 OWP in both those years while hitting over 20 HRs. McCraw was .505 and .474. Callison went over .600 in 1964 with 30 HRs and 100 RBIs. After Robinson, that was much better than any other Sox outfielder. The Sox could be blamed for trading those young prospects for quality, but aging veterans after 1959 in hopes of getting back to back pennants. This may not be fair. Let’s see why.
Cash was traded to the Indians and this brought Minnie Minoso back to the south side. None of the other players the Sox got in that one amounted to much or were traded for anyone who played key roles from 1963-67. But losing Cash hurt in the long run and there was no short term gain, as the Sox, of course, did not repeat in 1960.
Callison was traded for Gene Freese, who had a solid year for the Sox in 1960. That was all he did. But he was later traded for Pizarro, who turned in some good years (Pizarro was later traded for Wilbur Wood, who turned in a solid year in 1967). Battey was traded for slugger Roy Sievers, who hit over 20 HRs and had over 90 RBIs for two seasons. He was later traded for Buzhardt, who pitched alot for the Sox but was just a journeyman.
Mincher would have been a big help. A first baseman, his OWP in 1967 went over .700 playing almost full-time for the Angels. He hit 200 career HRs with a very solid .348 on-base percentage. On balance, these trades hurt. But one of the bad trades did lead to Pizarro and the Sox turned some good trades, too. The Sox got Agee, Romano, and Tommy John before the 1965 season for Landis and Hershberger, players who did not do much after that. Another big trade was when the Sox got Hansen, Wilhelm, Dave Nicholson and Ward from Baltimore for Aparicio and Al Smith in January, 1963. So we can’t blame trades since there some good ones and some bad ones.
The following players received votes for the AL MVP award: 1963-Peters finished 8th in the voting and Ward 9th. 1964-Ward 6th, Peters 7th, Robinson 15th and Hansen 16th. 1965-Fisher, 4th. 1966-Agee, 8th. 1967-Horlen, 4th (ahead of Lonborg, who was 6th!!), Peters, 8th, Hansen, 14th (who was also 17th another year). Sure looks like Hansen should be remembered as one of the top AL players of the mid-60s.
To round things out, here are the players and pitchers who were on the Sox for all five years: Peters, Horlen, utility infielder Al Weis, Hansen, Ward, part-time catcher J.C. Martin, first baseman Tommy McCraw, infielder Don Buford, and pitcher John Buzhardt. Hansen was the starting SS for all but 1966 when he was hurt. Ward was the regular 3B man except for 1966 when he only played half the season. The following pitchers and players were there for four seasons: Robinson, pitchers Fisher and Buzhardt. Plus who could forget pinch hitting specialist Smoky Burgess, who did have 5ABs in 1964. These players were the core of a great team.
Thursday, August 12, 2010
Update on Blue Jays and Astros Offenses
My first post on the Astros was Astros Offense On Record Setting Low Pace. Right now their OPS is .665 and the league average is .729. So .665/.729 = .912, giving them a relative OPS of about 91. That would put them in the bottom 25 since 1993.
If you have read my other posts on this, you might notice that the Astros have been doing better as the season has gone along. Here are their relative OPS figures each month this year starting with April:
.609/.735 = .829
.605/.726 = .833
.691/.720 = .960
.721/.731 = .986
.737/.728 = 1.01
The Astros have an OPS+ of 78 according to Baseball Reference. It takes park effects into effect as well as the league average (it is calculated a little differently than above). That is last in the NL this year. The Pirates are next lowest at 82. The lowest team OPS+ I found going all the way back to 1920 was 69 for the 1920 Philadelphia A's.
The Blue Jays have an isolated power (ISO) of .210 since their SLG is .460 and their AVG is .250. That is higher than the all-time record of .205 by the 1997 Mariners. Relative to the league average, it would be the third highest since 1900, at 142 (.210/.148 = 1.42). The league ISO in the AL this year is .148. The 1927 Yankees are the highest in relative ISO at 153. My first post on this was Blue Jays On Record Power Pace.
If you have read my other posts on this, you might notice that the Astros have been doing better as the season has gone along. Here are their relative OPS figures each month this year starting with April:
.609/.735 = .829
.605/.726 = .833
.691/.720 = .960
.721/.731 = .986
.737/.728 = 1.01
The Astros have an OPS+ of 78 according to Baseball Reference. It takes park effects into effect as well as the league average (it is calculated a little differently than above). That is last in the NL this year. The Pirates are next lowest at 82. The lowest team OPS+ I found going all the way back to 1920 was 69 for the 1920 Philadelphia A's.
The Blue Jays have an isolated power (ISO) of .210 since their SLG is .460 and their AVG is .250. That is higher than the all-time record of .205 by the 1997 Mariners. Relative to the league average, it would be the third highest since 1900, at 142 (.210/.148 = 1.42). The league ISO in the AL this year is .148. The 1927 Yankees are the highest in relative ISO at 153. My first post on this was Blue Jays On Record Power Pace.
Tuesday, August 3, 2010
Is This An Era When Pitchers Don't Hit Enough Opposing Batters To Show Them Who's Boss?
On the Tigers radio broadcast of the White Sox-Tigers game, the analyst, Jim Price I think, who was a Tigers catcher, said something like "the pitcher needs to make some of the White Sox hitters dance." The Sox were pounding the Tigers, leading 12-1 in the 8th. But then Price said something like "it is a different era, but in my day we would have been throwing at someone."
I have done some work on this. I don't think this is an era when pitchers are afraid to throw inside or hit a batter. Here are some findings, in no particular order:
From More On The Changing Historical Relationship Between Walks, HBPs and HRs
From The Changing Historical Relationship Between Walks, HBPs and HRs
From Do Sluggers Get Hit By The Pitch More Than They Used To?
From 2000-2009, here is the equation
HBP% = 0.0477*HR% + 0.009
The denominator for both HBP & HR was AB + HBP. The t-value for HR% was 1.97. The equation from the 1960s was
HBP% = 0.0311*HR% + 0.0058
Since .0477/.0311 = 1.53, it means that hitting a HR from 2000-2009 was 53% more likely to get you hit by a pitch than in the 1960s.
I have done some work on this. I don't think this is an era when pitchers are afraid to throw inside or hit a batter. Here are some findings, in no particular order:
From More On The Changing Historical Relationship Between Walks, HBPs and HRs
-There is a significant positive relationship between a pitcher's walk rate and his HBP rate
-In the 1960s, a pitcher who gave up more HRs hit fewer batters but today a pitcher who gives up more HRs hits more batters.
From The Changing Historical Relationship Between Walks, HBPs and HRs
-For both leagues, the HBP/Walk rate has been rising since 1980 (so poor control is not the only reason for more HBP).
-In recent years (up through 2007), the HBP/HR rate has been relatively high, even adjusting HBPs for control as measured by the walk rate.
From Do Sluggers Get Hit By The Pitch More Than They Used To?
-players who hit HRs more frequently are now more likely to get hit by a pitch than in the the 50s, 60s and 70s.
-hitting a HR in the 1990s was 83% more dangerous than it was in the 1960s in terms of causing the player to be HBP.
From 2000-2009, here is the equation
HBP% = 0.0477*HR% + 0.009
The denominator for both HBP & HR was AB + HBP. The t-value for HR% was 1.97. The equation from the 1960s was
HBP% = 0.0311*HR% + 0.0058
Since .0477/.0311 = 1.53, it means that hitting a HR from 2000-2009 was 53% more likely to get you hit by a pitch than in the 1960s.
Sunday, August 1, 2010
The Rays Are Only Good In "Clutch" Situations
They have the second best record in baseball. But it looks like that is only because they are especially good in "clutch" situations. The table below shows the OBP & SLG by their hitters and the OBP & SLG allowed by be their pitchers.
With no runners on, they rank fairly low.
This does not look very impressive. But the next table shows the rankings with runners on base and they are well ahead of everyone else.


They have a solid edge over their opponents in OBP (.338 vs. .304). But they have almost no power edge, since they only out-slug their opponents .406-.402. Then they have a solid but not great edge in OBP with no runners on (.324-.304). The incredible thing is that they are out-slugged by their opponents with no runners on, .399-.414.
But notice what happens with runners on. They have big edges in both OBP (.048) and SLG (.027). The edges only get alot bigger with runners in scoring position (RISP). Their OBP edge grows to .069 while their SLG edge is .072. They are no slouches in close and late situations, either. Their OBP edge is .080 and their SLG edge is .071. The Rays may have discovered the secret not only to clutch hitting, but clutch pitching as well.
The next table shows where the Rays rank in the AL in the differential of what I will simply call OPS*. It is 1.8*OBP + SLG. Most analysts acknowledge that OBP is more important than SLG and a weight of 1.8 is often used. This table shows where the Rays rank in all situations.
All Situations

With no runners on, they rank fairly low.
With No Runners On

This does not look very impressive. But the next table shows the rankings with runners on base and they are well ahead of everyone else.
With Runners On Base

They are equally impressive with RISP.
With Runners In Scoring Position

They are also first in close and late situations.
Close And Late Situations

Friday, July 30, 2010
Why Isn't Steve Garvey In The Hall Of Fame?
This was first posted in May of 2009. Go to Why Isn't Steve Garvey In The Hall Of Fame?. It has generated comments every few months, so if people are interested I thought I would post it again. What I tried to show was that he seems to be the kind of player the writers like to vote in and that you could make a good case for him, that is, write an impressive plaque. But he has not made it. I don't think he was good enough, but the puzzle is why he has not made it.
Here is one slightly new tidbit. Last year I mentioned that Garvey had 6 200+ hit seasons. Through 2009, here are all the players who had 4 or more. Alot of them are in the Hall of Fame or will probably make it, or would have made it without doing something scandalous:
Pete Rose 10
Ty Cobb 9
Ichiro Suzuki 9
Lou Gehrig 8
Willie Keeler 8
Paul Waner 8
Rogers Hornsby 7
Derek Jeter 7
Wade Boggs 7
Charlie Gehringer 7
Steve Garvey 6
Bill Terry 6
Stan Musial 6
Jesse Burkett 6
George Sisler 6
Sam Rice 6
Al Simmons 6
Kirby Puckett 5
Chuck Klein 5
Tony Gwynn 5
Michael Young 5
Harry Heilmann 4
Jack Tobin 4
Roberto Clemente 4
Joe Jackson 4
Tris Speaker 4
Paul Molitor 4
Juan Pierre 4
Jim Rice 4
Joe Medwick 4
Heinie Manush 4
Vada Pinson 4
Lou Brock 4
Vladimir Guerrero 4
Lloyd Waner 4
Nap Lajoie 4
Rod Carew 4
Here is one slightly new tidbit. Last year I mentioned that Garvey had 6 200+ hit seasons. Through 2009, here are all the players who had 4 or more. Alot of them are in the Hall of Fame or will probably make it, or would have made it without doing something scandalous:
Pete Rose 10
Ty Cobb 9
Ichiro Suzuki 9
Lou Gehrig 8
Willie Keeler 8
Paul Waner 8
Rogers Hornsby 7
Derek Jeter 7
Wade Boggs 7
Charlie Gehringer 7
Steve Garvey 6
Bill Terry 6
Stan Musial 6
Jesse Burkett 6
George Sisler 6
Sam Rice 6
Al Simmons 6
Kirby Puckett 5
Chuck Klein 5
Tony Gwynn 5
Michael Young 5
Harry Heilmann 4
Jack Tobin 4
Roberto Clemente 4
Joe Jackson 4
Tris Speaker 4
Paul Molitor 4
Juan Pierre 4
Jim Rice 4
Joe Medwick 4
Heinie Manush 4
Vada Pinson 4
Lou Brock 4
Vladimir Guerrero 4
Lloyd Waner 4
Nap Lajoie 4
Rod Carew 4
Wednesday, July 28, 2010
Close and late hitting vs. non-close and late hitting since 1950
The first link tells you the batting average (AVG) and isolated power (ISO) each year in the AL for both close and late hitting vs. non-close and late hitting since 1950. All data from Retrosheet.
AL Close and late hitting vs. non-close and late hitting
Now the same thing for the NL
NL Close and late hitting vs. non-close and late hitting
This next link simply shows the differences in each stat between the situations in both leagues. Numbers in red are positive or zero. Those pretty much stopped in the 1980s. That is, since 1990, AVG and ISO have pretty much been lower in the close and late situations than otherwise.
Yearly differences of each league
The graph below shows the annual difference in AVG in the AL.

Now for the annual differences in ISO in the AL

The next two graphs do the same thing for the NL.


AL Close and late hitting vs. non-close and late hitting

Now the same thing for the NL
NL Close and late hitting vs. non-close and late hitting

This next link simply shows the differences in each stat between the situations in both leagues. Numbers in red are positive or zero. Those pretty much stopped in the 1980s. That is, since 1990, AVG and ISO have pretty much been lower in the close and late situations than otherwise.
Yearly differences of each league

The graph below shows the annual difference in AVG in the AL.

Now for the annual differences in ISO in the AL
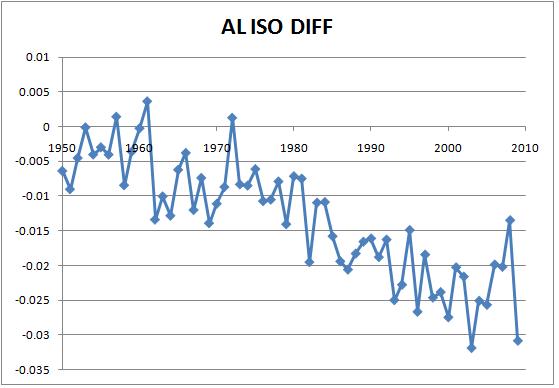
The next two graphs do the same thing for the NL.
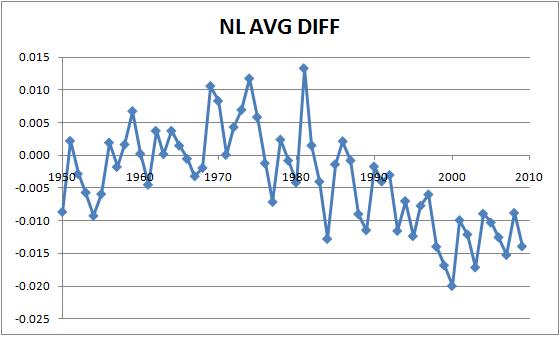

Sunday, July 25, 2010
Was It Easier To Be A Good Clutch Hitter In The "Old" Days?
I first reported on this issue in a post last year Did The Increased Use Of Relief Pitching Cause A Decline In Clutch Hitting? Back in the 1950s and 1960s, as I show at this earlier post, hitting in non-close and late situations was not much better than in close and late situations. But, as I also showed, as the use of relief pitching grew, batting averages and isolated power started to decline, relatively, in close and late situations. So it looks like it might have been easier to hit well in the clutch in the "old" days.
Recently Tom Tango (aka tangotiger) had a post titled Best and Worst Clutch Hitters of the Retrosheet era .
Tom has a clutch stat based on WPA or "win probability added." The idea there is that every plate appearance by a hitter either increases or decreases his team's probability of winning. A HR with the score tied in the bottom of the 9th has more impact than one in the first inning with the score 10-0.
But Tom adjusts this by how often a hitter gets to hit in "high leverage" situations. Then that it is compared to what his WPA would be if he always hit in average leverage situations. I hope I got that right. But, of course, Tom explains it much better. That stat ends up telling us how many more games a player's team wins (or loses) because he hits better or worse in high leverage situations than he does overall. It is just called "Clutch."
To see if this stat changed over time, I took all the players with 4000+ PAs from 1950-2009 and found their Clutch/PA (758 players). Then I found the the year which was the mid-point of each player's career (the data all comes from Baseball Reference which showed the first and last year of each guy's career). Of course, that is not a perfect way to do it since that may not be finding the exact middle of a player's career in terms of PAs. But it is a reasonable approximation. Call this mid-point "Year."
Anyway, the correlation between Year and Clutch/PA is -.12. That is, as time goes on, batters are doing worse in the clutch. That makes sense given the increasing use and specialization of relief pitching. The -.12 is small, though. But, as time went on, there were more players reaching the 4000 PA minimum because there were more teams and in the early 1960s, the season grew to 162 games. So any correlation will have alot more guys from the later years when everyone was doing worse in the clutch. This waters down any correlation we might find (by the way, if you are interested, Yogi Berra, famous for being a clutch hitter, ranks 37th out of 758 players).
But if we look at the top and bottom 25 in Clutch/PA, we can see some interesting trends. The table below shows the top 25 along with their mid-point year.

If you look carefully at the mid-point years, you can see that there are more players from earlier years. But this will be summarized below. The next table shows the bottom 25.

It actually turns out that the top 25 has a disproportionate number of guys from earlier years and the bottom 25 has disproportionate number of guys from later years. The next two tables shows this. The first table shows what percentge or share of the 758 players comes from each decade.

The next table shows how many players were in the top 25 and the bottom 25 from each decade and the expected number based on the percentage from the table above. 2.18 is about 8.7% of 25, for example. Notice that the 1950s had 4 guys in the top 25 while its expected number is 2.18. The 1960s and 1970s also had more guys in the top 25 than expected. We can also see that the 2000s had none in the top 25 even though 4.49 were expected.
The 1950s, 60s and 70s did not have as many guys as expected in the bottom 25 while the 1990s and 2000s had more than expected. So it could be that it is harder to hit well in the clutch now than 4-5 decades ago. My guess is that this is due to relief pitching.

Update July 26:
I divided all the players into 6 groups since there are about 6 decades. And since 758/6 = 126.33, I looked at the top 126 and the bottom 126. The table below summarizes how many guys from each decade were in each group along with the expected number.

The 1950s don't have as many as expected in the top 126 and more than expected in the bottom. But the 1960s do have more in the top and fewer in the bottom. Same for the 1970s and 1980s. But the last two decades are very much under-represented in the top and very over-represented in the bottom. So this suggests it is harder to be a good clutch hitter in current times.
Recently Tom Tango (aka tangotiger) had a post titled Best and Worst Clutch Hitters of the Retrosheet era .
Tom has a clutch stat based on WPA or "win probability added." The idea there is that every plate appearance by a hitter either increases or decreases his team's probability of winning. A HR with the score tied in the bottom of the 9th has more impact than one in the first inning with the score 10-0.
But Tom adjusts this by how often a hitter gets to hit in "high leverage" situations. Then that it is compared to what his WPA would be if he always hit in average leverage situations. I hope I got that right. But, of course, Tom explains it much better. That stat ends up telling us how many more games a player's team wins (or loses) because he hits better or worse in high leverage situations than he does overall. It is just called "Clutch."
To see if this stat changed over time, I took all the players with 4000+ PAs from 1950-2009 and found their Clutch/PA (758 players). Then I found the the year which was the mid-point of each player's career (the data all comes from Baseball Reference which showed the first and last year of each guy's career). Of course, that is not a perfect way to do it since that may not be finding the exact middle of a player's career in terms of PAs. But it is a reasonable approximation. Call this mid-point "Year."
Anyway, the correlation between Year and Clutch/PA is -.12. That is, as time goes on, batters are doing worse in the clutch. That makes sense given the increasing use and specialization of relief pitching. The -.12 is small, though. But, as time went on, there were more players reaching the 4000 PA minimum because there were more teams and in the early 1960s, the season grew to 162 games. So any correlation will have alot more guys from the later years when everyone was doing worse in the clutch. This waters down any correlation we might find (by the way, if you are interested, Yogi Berra, famous for being a clutch hitter, ranks 37th out of 758 players).
But if we look at the top and bottom 25 in Clutch/PA, we can see some interesting trends. The table below shows the top 25 along with their mid-point year.

If you look carefully at the mid-point years, you can see that there are more players from earlier years. But this will be summarized below. The next table shows the bottom 25.

It actually turns out that the top 25 has a disproportionate number of guys from earlier years and the bottom 25 has disproportionate number of guys from later years. The next two tables shows this. The first table shows what percentge or share of the 758 players comes from each decade.

The next table shows how many players were in the top 25 and the bottom 25 from each decade and the expected number based on the percentage from the table above. 2.18 is about 8.7% of 25, for example. Notice that the 1950s had 4 guys in the top 25 while its expected number is 2.18. The 1960s and 1970s also had more guys in the top 25 than expected. We can also see that the 2000s had none in the top 25 even though 4.49 were expected.
The 1950s, 60s and 70s did not have as many guys as expected in the bottom 25 while the 1990s and 2000s had more than expected. So it could be that it is harder to hit well in the clutch now than 4-5 decades ago. My guess is that this is due to relief pitching.

Update July 26:
I divided all the players into 6 groups since there are about 6 decades. And since 758/6 = 126.33, I looked at the top 126 and the bottom 126. The table below summarizes how many guys from each decade were in each group along with the expected number.

The 1950s don't have as many as expected in the top 126 and more than expected in the bottom. But the 1960s do have more in the top and fewer in the bottom. Same for the 1970s and 1980s. But the last two decades are very much under-represented in the top and very over-represented in the bottom. So this suggests it is harder to be a good clutch hitter in current times.
Thursday, July 22, 2010
Don't Let Your Little Leaguers Grow Up To Be Right-Handed Power Hitters Who Strike Out Alot Because They Might Choke In the Clutch
This is prompted by a post by Tom Tango (aka tangotiger) titled Best and Worst Clutch Hitters of the Retrosheet era .
Tom has a clutch stat based on WPA or "win probability added." The idea there is that every plate appearance by a hitter either increases or decreases his team's probability of winning. A HR with the score tied in the bottom of the 9th has more impact than one in the first inning with the score 10-0.
But Tom adjusts this by how often a hitter gets to hit in "high leverage" situations. Then that it is compared to what his WPA would be if he always hit in average leverage situations. I hope I got that right. But, of course, Tom explains it much better. That stat ends up telling us how many more games a player's team wins (or loses) because he hits better or worse in high leverage situations than he does overall.
Nellie Fox is #1 with +13.4 wins since 1950. That is, by hitting better than he normally did in high leverage situations, he added 13.4 wins to his teams over his whole career. Sammy Sosa was last with -16.8 wins. That is, he hit worse in high leverage situations than he normally did and this cost his teams 16.8 wins over the course of his career. These two hitters maybe could not be more different and they may be good illustrations of what is going on with this clutch stat.
So let's call Tom's stat Clutch. That's what it is called at Baseball Reference. I took all the right-handed batters and left-handed batters since 1950 who had 4000+ PAs (653 players). Then I divided their Clutch stat by their PAs. I did the same thing for HRs and strikeouts. The I ran a regression with Clutch/PA being the dependent variable and HR/PA and SO/PA being the independent variables. I also added a dummy variable for being a righty (1 for righties and 0 for lefties).
Here is the regression equation
Clutch/PA = 0.0007 - .00025*Righty - .0169*HR/PA - .00157*SO/PA
All three variables seem to be significant. Here are the t-values:
Righty -6.31
HR/PA -10.49
SO/PA -3.06
R-squared is .314 (meaning that 31.4% of the variation in Clutch/PA across players is explained by the equation) and the standard error per 700 PAs is .33.
Mutltiplying -.00025*700 gives us -.172 (assuming 700 PAs is a full season). So simply being a righty means you will have a negative Clutch rating of -.172, meaning you will cost your team .172 wins. This could be because righties can't use the hole at first base with a runner on as well as lefties. When a runner is on first, it makes for a slightly higher leverage situation. Also, righties might have to face right-handed pitchers more often in high leverage situations than lefties face left-handed pitchers.
To see the impact of HRs and SOs, I found the standard deviation of HR/PA and SO/PA and then checked to see how much Clutch/PA would change with a one standard deviation increase in both stats. Here they are
HR/PA: .014
SO/PA: .0449
The coefficient on HR/PA was -.0169. That times .014 = -0.00024. But that times 700 PAs is about -.166. So being one standard deviation above average in HR/PA costs your team .166 wins per season. Maybe HR hitters cannot adapt well in high leverage situations since they generally just swing for the fences. But that is just a guess.
Something similar could be going on for guys who strikeout alot. The coefficient on SO/PA was -.00157. That times .0449 = -0.00007. That times 700 = -.049. So increasing your strikeout rate by one standard deviation costs your team .049 wins per season. Maybe guys who don't strikeout alot have better bat control and they can hit the ball the hole at first base better than average or they can adapt to the situation better.
Let's look at how all this affects Nellie Fox. He was a lefty, so he does not get the righty penalty. His career HR/PA = .003488. The average for all the players in the sample was .0268. So he was .0233 below that. To see the effect for the whole season, we multiply that first by -.0169, the coefficient on HR/PA from the regression equation and then times 700. This gives us -.0233*-.0169*700 = .276. So his lack of power added .276 wins to his teams each year.
What about for his entire career. He had 10,035 career PAs or 14.33 seasons. With 14.33*.276 = 3.96, Fox gets 3.96 clutch wins for his whole career just due to his lack of power.
For SO, Fox had a career rate of .0206. The average was .133. So he was .112 below that. Let's multiply that by -.00157 and then 700 to get .122 (-.00157 was the coefficient on SO/PA). It amounts to -.112*-.00157*700 = .122. So his ability to not strike out gave his teams .122 clutch wins per season. For his career that would be 1.76 Clutch wins. Then 3.96 + 1.76 = 5.72. Just by being a low HR, low SO guy added 5.72 clutch wins. That is nearly half his total.
For Sosa, we have a HR/PA rate of .06154 and a SO/PA rate of .233. Doing the same exercise as I did above for Fox has him with the following "clutch losses" per season due to his high HR rate and high SO rate:
HR/PA = .41
SO/PA = .11
Sosa had 9,986 career PAs or 14.14 seasons. His HR hitting cost him 5.81 clutch wins and his striking out cost him 1.54. And being a righty cost him 2.43 wins (14.14*.172 = 2.43). The .172 was how many wins a righty lost per year, as explained above. Then 5.81 + 1.54 + 2.43 = 9.78. That is more than half of his clutch losses.
All of this, is, of course, an approximation. The regression is not perfect, since the r-squared was only .314. But the variables all were significant and the F-stat was 98 (that is significant and it means that the 3 variables together probably explain some part of the dependent variable).
So Tom Tango's clutch stat is great in terms of what clutch stats should do but it may have some biases. But those biases might be ones teams should care about since HR hitting ability and SO avoidance ability are identifiable traits.
******************************************
I did a very different kind of study several years ago called Do Power Hitters Choke in the Clutch?. I have a link to a similar study by Andrew Dolphin. In this other study it did not look like they did choke. Also, here are some other comments I made at the tangotiger link:
I happened to have a list of players with 6000+ PAs from 1987-2001 with their OPS in close and late situations (CL) and their OPS in non-CL situations. I took the ratio of CL/nonCL. Tino Martinez did the best, with 1.095, meaning that his OPS in CL situations was 9.5% higher than nonCL. The correlation between CL OPS/nonCL OPS and SO/PA is -.364. So it looks like guys who strikeout alot have a little harder time doing well in the clutch
Also, if you go to the rankings, you can see that 10 of the 12 best players in maintaining their OPS in the CL were lefties or switch hitters
http://cyrilmorong.com/clutch.htm
And it looks like 8 of the bottom twelve are righties
Tom has a clutch stat based on WPA or "win probability added." The idea there is that every plate appearance by a hitter either increases or decreases his team's probability of winning. A HR with the score tied in the bottom of the 9th has more impact than one in the first inning with the score 10-0.
But Tom adjusts this by how often a hitter gets to hit in "high leverage" situations. Then that it is compared to what his WPA would be if he always hit in average leverage situations. I hope I got that right. But, of course, Tom explains it much better. That stat ends up telling us how many more games a player's team wins (or loses) because he hits better or worse in high leverage situations than he does overall.
Nellie Fox is #1 with +13.4 wins since 1950. That is, by hitting better than he normally did in high leverage situations, he added 13.4 wins to his teams over his whole career. Sammy Sosa was last with -16.8 wins. That is, he hit worse in high leverage situations than he normally did and this cost his teams 16.8 wins over the course of his career. These two hitters maybe could not be more different and they may be good illustrations of what is going on with this clutch stat.
So let's call Tom's stat Clutch. That's what it is called at Baseball Reference. I took all the right-handed batters and left-handed batters since 1950 who had 4000+ PAs (653 players). Then I divided their Clutch stat by their PAs. I did the same thing for HRs and strikeouts. The I ran a regression with Clutch/PA being the dependent variable and HR/PA and SO/PA being the independent variables. I also added a dummy variable for being a righty (1 for righties and 0 for lefties).
Here is the regression equation
Clutch/PA = 0.0007 - .00025*Righty - .0169*HR/PA - .00157*SO/PA
All three variables seem to be significant. Here are the t-values:
Righty -6.31
HR/PA -10.49
SO/PA -3.06
R-squared is .314 (meaning that 31.4% of the variation in Clutch/PA across players is explained by the equation) and the standard error per 700 PAs is .33.
Mutltiplying -.00025*700 gives us -.172 (assuming 700 PAs is a full season). So simply being a righty means you will have a negative Clutch rating of -.172, meaning you will cost your team .172 wins. This could be because righties can't use the hole at first base with a runner on as well as lefties. When a runner is on first, it makes for a slightly higher leverage situation. Also, righties might have to face right-handed pitchers more often in high leverage situations than lefties face left-handed pitchers.
To see the impact of HRs and SOs, I found the standard deviation of HR/PA and SO/PA and then checked to see how much Clutch/PA would change with a one standard deviation increase in both stats. Here they are
HR/PA: .014
SO/PA: .0449
The coefficient on HR/PA was -.0169. That times .014 = -0.00024. But that times 700 PAs is about -.166. So being one standard deviation above average in HR/PA costs your team .166 wins per season. Maybe HR hitters cannot adapt well in high leverage situations since they generally just swing for the fences. But that is just a guess.
Something similar could be going on for guys who strikeout alot. The coefficient on SO/PA was -.00157. That times .0449 = -0.00007. That times 700 = -.049. So increasing your strikeout rate by one standard deviation costs your team .049 wins per season. Maybe guys who don't strikeout alot have better bat control and they can hit the ball the hole at first base better than average or they can adapt to the situation better.
Let's look at how all this affects Nellie Fox. He was a lefty, so he does not get the righty penalty. His career HR/PA = .003488. The average for all the players in the sample was .0268. So he was .0233 below that. To see the effect for the whole season, we multiply that first by -.0169, the coefficient on HR/PA from the regression equation and then times 700. This gives us -.0233*-.0169*700 = .276. So his lack of power added .276 wins to his teams each year.
What about for his entire career. He had 10,035 career PAs or 14.33 seasons. With 14.33*.276 = 3.96, Fox gets 3.96 clutch wins for his whole career just due to his lack of power.
For SO, Fox had a career rate of .0206. The average was .133. So he was .112 below that. Let's multiply that by -.00157 and then 700 to get .122 (-.00157 was the coefficient on SO/PA). It amounts to -.112*-.00157*700 = .122. So his ability to not strike out gave his teams .122 clutch wins per season. For his career that would be 1.76 Clutch wins. Then 3.96 + 1.76 = 5.72. Just by being a low HR, low SO guy added 5.72 clutch wins. That is nearly half his total.
For Sosa, we have a HR/PA rate of .06154 and a SO/PA rate of .233. Doing the same exercise as I did above for Fox has him with the following "clutch losses" per season due to his high HR rate and high SO rate:
HR/PA = .41
SO/PA = .11
Sosa had 9,986 career PAs or 14.14 seasons. His HR hitting cost him 5.81 clutch wins and his striking out cost him 1.54. And being a righty cost him 2.43 wins (14.14*.172 = 2.43). The .172 was how many wins a righty lost per year, as explained above. Then 5.81 + 1.54 + 2.43 = 9.78. That is more than half of his clutch losses.
All of this, is, of course, an approximation. The regression is not perfect, since the r-squared was only .314. But the variables all were significant and the F-stat was 98 (that is significant and it means that the 3 variables together probably explain some part of the dependent variable).
So Tom Tango's clutch stat is great in terms of what clutch stats should do but it may have some biases. But those biases might be ones teams should care about since HR hitting ability and SO avoidance ability are identifiable traits.
******************************************
I did a very different kind of study several years ago called Do Power Hitters Choke in the Clutch?. I have a link to a similar study by Andrew Dolphin. In this other study it did not look like they did choke. Also, here are some other comments I made at the tangotiger link:
I happened to have a list of players with 6000+ PAs from 1987-2001 with their OPS in close and late situations (CL) and their OPS in non-CL situations. I took the ratio of CL/nonCL. Tino Martinez did the best, with 1.095, meaning that his OPS in CL situations was 9.5% higher than nonCL. The correlation between CL OPS/nonCL OPS and SO/PA is -.364. So it looks like guys who strikeout alot have a little harder time doing well in the clutch
Also, if you go to the rankings, you can see that 10 of the 12 best players in maintaining their OPS in the CL were lefties or switch hitters
http://cyrilmorong.com/clutch.htm
And it looks like 8 of the bottom twelve are righties
Sunday, July 18, 2010
Catcher Bengie Molina Hits For The Cycle. So How Slow Is He?
He hit only his 6th career triple in the game and that was after over 4,000 ABs. That sounds slow.
I have a theory that you can get a general idea of a guy's speed or base running ability by looking at his triple-to-double ratio. Some fast guys don't hit the ball hard enough or often enough to get many triples, so just using triples is not enough to gauge speed. And some guys who may not be that fast might get alot of triples more because they are good hitters.
But if you look at this ratio, it tells you how often a guy made it to third relative to how many times they had to stop at second. And if you get thrown out at third, you get a double. Fast guys will turn long hits into triples more often than slow guys who must stop at 2nd.
But Voros McCracken has a better way to do it. Take the following ratio: 3B/(2B + 3B). This makes it an average or a rate. It tells us what percentage of the time a batter was successful when he had a chance to make it to third with a triple instead of a double.
Let's see where Molina ranks in this stat. To do that, I found all the right-handed batters from 1960-2009 who had 4,000+ ABs. The table below shows the top ten and the bottom ten.

The average rate for righties was .110. That means that the average righty was 4.6 times more likely to get a triple instead of a double than Molina (.110/.024 = 4.62). The next table shows the top ten and bottom ten for lefties. Their average rate was .131.

The next table shows the top ten and bottom ten for switch hitters. Their average rate was .146 (I have no idea why it is higher than the lefties' rate).

I have a theory that you can get a general idea of a guy's speed or base running ability by looking at his triple-to-double ratio. Some fast guys don't hit the ball hard enough or often enough to get many triples, so just using triples is not enough to gauge speed. And some guys who may not be that fast might get alot of triples more because they are good hitters.
But if you look at this ratio, it tells you how often a guy made it to third relative to how many times they had to stop at second. And if you get thrown out at third, you get a double. Fast guys will turn long hits into triples more often than slow guys who must stop at 2nd.
But Voros McCracken has a better way to do it. Take the following ratio: 3B/(2B + 3B). This makes it an average or a rate. It tells us what percentage of the time a batter was successful when he had a chance to make it to third with a triple instead of a double.
Let's see where Molina ranks in this stat. To do that, I found all the right-handed batters from 1960-2009 who had 4,000+ ABs. The table below shows the top ten and the bottom ten.

The average rate for righties was .110. That means that the average righty was 4.6 times more likely to get a triple instead of a double than Molina (.110/.024 = 4.62). The next table shows the top ten and bottom ten for lefties. Their average rate was .131.

The next table shows the top ten and bottom ten for switch hitters. Their average rate was .146 (I have no idea why it is higher than the lefties' rate).

Thursday, July 15, 2010
Yes, They Sometimes Did Show Jubilation After Walk-Off HRs In The "Old" Days
Here is what was said at the Dallas Morning News blog by Guy Reynolds, Photo editor
The whole team did not go out to mob Henrich, as you can clearly see in the photo. See No jube at the plate? Archival photo shows walk-off home run in 1949 World Series. (Hat Tip: David Pinto's Baseball Musings)
I guess it depends on what you call old school (David Pinto's blog entry on this was titled "Old School Walk-Off"). This link shows Mazeroski’s series winning HR in 1960. I know it is different because it ended the series where as this one from 1949 was just the first game. But it looks like alot of the team came out to home plate to congratulate him as fans poured onto the field.
Mazeroski
Then there is Bobby Thomson’s series winning HR in the 1951 NL pennant playoff
Bobby Thomson
Again, it is a little different since it won a pennant.
But here is Dusty Rhode’s HR to win game 1 in the 1954 World Series. The whole team comes out to congratulate him at home plate and you also see Willie Mays jumping up and down as he rounds the bases. It is about 10 minutes long and the HR comes at the end, of course.
Dusty Rhodes
Here is a video that shows Eddie Mathews hitting a walkoff HR in game 4 in the 1957 World Series. It looks like a big celebration at home plate
Eddie Mathews
So sometimes in the old days they had big celebrations after walk-off HRs.
"I found this photo in the AP archives yesterday and wrote about the differences from 1949 and today on the Photography blog here . It's hard to believe that this shot was made as Tommy Henrich approached home plate after hitting a walk-off home run to win the first game of the '49 series 1-0. A World Series game! For some reason all the excessive exuberance shown today by players after every little thing bothers me. Seeing this old photo just made me smile."
The whole team did not go out to mob Henrich, as you can clearly see in the photo. See No jube at the plate? Archival photo shows walk-off home run in 1949 World Series. (Hat Tip: David Pinto's Baseball Musings)
I guess it depends on what you call old school (David Pinto's blog entry on this was titled "Old School Walk-Off"). This link shows Mazeroski’s series winning HR in 1960. I know it is different because it ended the series where as this one from 1949 was just the first game. But it looks like alot of the team came out to home plate to congratulate him as fans poured onto the field.
Mazeroski
Then there is Bobby Thomson’s series winning HR in the 1951 NL pennant playoff
Bobby Thomson
Again, it is a little different since it won a pennant.
But here is Dusty Rhode’s HR to win game 1 in the 1954 World Series. The whole team comes out to congratulate him at home plate and you also see Willie Mays jumping up and down as he rounds the bases. It is about 10 minutes long and the HR comes at the end, of course.
Dusty Rhodes
Here is a video that shows Eddie Mathews hitting a walkoff HR in game 4 in the 1957 World Series. It looks like a big celebration at home plate
Eddie Mathews
So sometimes in the old days they had big celebrations after walk-off HRs.
Wednesday, July 14, 2010
Update on Blue Jays and Astros Offenses
My first post on the Astros was Astros Offense On Record Setting Low Pace. Right now their OPS is .643 and the league average is .729. So .643/.729 = .882. That would be the 11th worst since 1969, as you can see from the table below.

They have been doing better lately. In June, the Astros had an OPS of .691 while the league average was .720. That is a ratio of .96. So far in July, it is .689/.733 for a ratio of .94.
The Astros have an OPS+ of 73 according to Baseball Reference. It takes park effects into effect as well as the league average (it is calculated a little differently than above). The lowest team OPS+ I found going all the way back to 1920 was 69 for the 1920 Philadelphia A's. So the Astros are close to that.
I am not sure what to make from the Astro's park ratings in the Bill James Handbook. For the years 2007-9, they have a run rating of 96, meaning that the runs scored in their park is 96% of the league average. But the rating for AVG is 101 and for HRs 108. So that indicates a slightly above average hitter's park. The walk rate is 98. That does not seem like enough to offset the HR and AVG ratings to say their park is a little hard on the hitters. The error rate is only 87. That might hold down the runs. My best guess is that when it comes to OPS, Minute Maid should be a little helpful to the Astros' hitters.
The Blue Jays have an isolated power (ISO) of .205 since their SLG is .445 and their AVG is .240. That is higher than the all-time record of .205 by the 1997 Mariners. Relative to the league average, it would be the third highest since 1900, at 138 (.205/.148 = 1.38). The league ISO in the AL this year is .148. The 1927 Yankees are the highest in realtive ISO at 153. My first post on this was Blue Jays On Record Power Pace.

They have been doing better lately. In June, the Astros had an OPS of .691 while the league average was .720. That is a ratio of .96. So far in July, it is .689/.733 for a ratio of .94.
The Astros have an OPS+ of 73 according to Baseball Reference. It takes park effects into effect as well as the league average (it is calculated a little differently than above). The lowest team OPS+ I found going all the way back to 1920 was 69 for the 1920 Philadelphia A's. So the Astros are close to that.
I am not sure what to make from the Astro's park ratings in the Bill James Handbook. For the years 2007-9, they have a run rating of 96, meaning that the runs scored in their park is 96% of the league average. But the rating for AVG is 101 and for HRs 108. So that indicates a slightly above average hitter's park. The walk rate is 98. That does not seem like enough to offset the HR and AVG ratings to say their park is a little hard on the hitters. The error rate is only 87. That might hold down the runs. My best guess is that when it comes to OPS, Minute Maid should be a little helpful to the Astros' hitters.
The Blue Jays have an isolated power (ISO) of .205 since their SLG is .445 and their AVG is .240. That is higher than the all-time record of .205 by the 1997 Mariners. Relative to the league average, it would be the third highest since 1900, at 138 (.205/.148 = 1.38). The league ISO in the AL this year is .148. The 1927 Yankees are the highest in realtive ISO at 153. My first post on this was Blue Jays On Record Power Pace.
Monday, July 12, 2010
Mercy! White Sox Storm Into First Place After Winning 8 Straight And 25 Out Of 30
It began with a 15-3 win over the Tigers on June 9. The Sox had 16 hits, including 3 HRs. They beat Detroit again the next day to take two out of three. In the last 30 games, the Sox have outscored their opponents 156-77. That gives them a Pythagorean winning pct of .804. In 30 games that would be 24.1 wins. All data is from Baseball Reference.
The Sox hitters have a .793 OPS in these games. The following formula shows the relationship between runs per game and OPS from 2001-04 (may not be the most accurate formula for this case, but I had it handy).
R/G = 13.27*OPS - 5.29
It predicts the Sox would score 5.22 runs per game. That is very close to what they have actually done (5.2). The Sox pitchers have allowed an OPS of .626. That would work out to about 3 runs per game or 90 total runs. They have actually only allowed 77.
The Sox OPS differential is .167. The next formula shows the relationship between OPS differential and winning pct.
Pct = 1.26*OPSDIFF + .5
This gives the Sox a pct of about .710. That would be only about 21 wins (which would still be very good). The big thing is that the Sox pitchers are allowing fewer runs than expected based on the OPS they have allowed. They must be doing well with runners on base in the last 30 games (but for the year they have allowed a .704 OPS overall while it is .741 with runners on). The Sox have out homered their opponents 34-17.
They have won or swept 9 of their last 10 series. The only series they lost was 2 out of 3 to the Royals a couple of weeks ago in KC. They avenged that with a 3 game sweep in Chicago, outscoring them 28-8. They beat the Tigers 2 out of 3 to start this run when the Tigers were in 2nd place. But the Tigers were recently in first place until yesterday. The Sox also swept the first place Braves and took 2 of 3 from the Rangers. And last week they swept the 2nd place Angels 4 straight in Chicago, outscoring them 19-5. In the five losses, the Sox have not lost by more than 2 runs, losing all 5 by a total of 9 runs.
Now if we can only get Oswalt from the Astros to take Peavy's place.
The Sox hitters have a .793 OPS in these games. The following formula shows the relationship between runs per game and OPS from 2001-04 (may not be the most accurate formula for this case, but I had it handy).
R/G = 13.27*OPS - 5.29
It predicts the Sox would score 5.22 runs per game. That is very close to what they have actually done (5.2). The Sox pitchers have allowed an OPS of .626. That would work out to about 3 runs per game or 90 total runs. They have actually only allowed 77.
The Sox OPS differential is .167. The next formula shows the relationship between OPS differential and winning pct.
Pct = 1.26*OPSDIFF + .5
This gives the Sox a pct of about .710. That would be only about 21 wins (which would still be very good). The big thing is that the Sox pitchers are allowing fewer runs than expected based on the OPS they have allowed. They must be doing well with runners on base in the last 30 games (but for the year they have allowed a .704 OPS overall while it is .741 with runners on). The Sox have out homered their opponents 34-17.
They have won or swept 9 of their last 10 series. The only series they lost was 2 out of 3 to the Royals a couple of weeks ago in KC. They avenged that with a 3 game sweep in Chicago, outscoring them 28-8. They beat the Tigers 2 out of 3 to start this run when the Tigers were in 2nd place. But the Tigers were recently in first place until yesterday. The Sox also swept the first place Braves and took 2 of 3 from the Rangers. And last week they swept the 2nd place Angels 4 straight in Chicago, outscoring them 19-5. In the five losses, the Sox have not lost by more than 2 runs, losing all 5 by a total of 9 runs.
Now if we can only get Oswalt from the Astros to take Peavy's place.
Sunday, July 11, 2010
Rating Hitters By Their Home Runs As A Percentage of Their Strikeouts, aka The "Splinter Score"
Derrick Gold and Joe Strauss recently came up with a stat they call the "splinter score." It is HRs divided by strikeouts. But neither HRs or K's are adjuted for era or the league average. See Bird Land 10@10: Pujols, Musial & the Splendid Splinter Scale. (hat tip: Baseball Think Factory)
Just about a year ago I posted an entry called Which Players Had The Best HR-To-Strikeout Ratios? Here is that post.
*************************************************
I looked at every player with 5000+ PAs since 1920. I found their relative HRs and their relative strikeouts. Then found the ratio of the two. Ken Williams, for example, hit 3.70 times as many HRs as the average player of his time and league while striking out only 75% as often as the average player. Since his ratio of ratios (3.7/.75 = 4.93) is the highest of anyone in the study, he is ranked first. The data comes from the Lee Sinins Complete Baseball Encyclopedia. The table below shows the top 25:

DiMaggio hit only 41% of his HRs at home in his career while Williams hit 72%. So it is likely the case that DiMaggio would rank first, and probably by a wide margin, if HRs were park adjusted. Ted Williams hit less than 50% of his HRs at home.
The next table shows which players had the lowest relative strikeout rates among guys who hit 40+ HRs. Again, no pikers here. In 2004, Bonds had only 41 strikeouts while the average player would have had 100. I am so proud to see the demonstration of Polish power with 3 for Ted Kluszewski and 1 for Carl Yastrzemski (whose 1970 season ranks 27th). Don't forget Stan Musial is 13th on the above list.

Just about a year ago I posted an entry called Which Players Had The Best HR-To-Strikeout Ratios? Here is that post.
*************************************************
I looked at every player with 5000+ PAs since 1920. I found their relative HRs and their relative strikeouts. Then found the ratio of the two. Ken Williams, for example, hit 3.70 times as many HRs as the average player of his time and league while striking out only 75% as often as the average player. Since his ratio of ratios (3.7/.75 = 4.93) is the highest of anyone in the study, he is ranked first. The data comes from the Lee Sinins Complete Baseball Encyclopedia. The table below shows the top 25:

DiMaggio hit only 41% of his HRs at home in his career while Williams hit 72%. So it is likely the case that DiMaggio would rank first, and probably by a wide margin, if HRs were park adjusted. Ted Williams hit less than 50% of his HRs at home.
The next table shows which players had the lowest relative strikeout rates among guys who hit 40+ HRs. Again, no pikers here. In 2004, Bonds had only 41 strikeouts while the average player would have had 100. I am so proud to see the demonstration of Polish power with 3 for Ted Kluszewski and 1 for Carl Yastrzemski (whose 1970 season ranks 27th). Don't forget Stan Musial is 13th on the above list.

Subscribe to:
Posts (Atom)