In his career, here is his OPS for each month starting with April
.863
.713
.919
.871
.906
.859
I noticed he had a bad May again this year. In every year of his career his OPS is lower in May than it is for the season. Sometimes alot lower. Has anyone ever seen anything like this? Is it unusual? Any reason why?
The White Sox have played more road games in May than home games during the course of his career. But that probably would not account for much of the difference. His career home OPS is .919 while on the road it is .791. That is only a .128 difference. But notice that it falls .150 and then goes back up .206. Those changes are much larger than his home/road split. If he were a slow starter, then April would be low. If he tailed off as the weather got hot, June would be low. But both April and June are high.
His OPS was .712 in May this year while it is .971 overall. His next lowest month this year is Sept. at .895. April was 1.197 while June was 1.000.
Wednesday, September 29, 2010
Sunday, September 26, 2010
Blue Jays Still Have Chance To Set Isolated Power Record
Including today's game, they have a .24762 AVG and a .45150 SLG. That gives them an ISO of .20388. That is just actually a little less than the record set by the Mariners in 1997, who had .20413. Their AVG was .28037 and their SLG was .48450. That puts them just 0.00025 ahead of the Blue Jays.
My first post on this was Blue Jays On Record Power Pace.
My first post on this was Blue Jays On Record Power Pace.
Wednesday, September 22, 2010
Twins Clinch Division Title Behind a .714 Second Half Winning Percentage
The Twins are 45-18 since the All-Star break. That .714 pct., as I mentioned last week, was the same one the 1927 Yankees had. The Twins were 46-42 at the break.
Who predicted, or could have predicted, that they would do so well in the 2nd half, especially without Morneau? Jim Thome has an OPS+ of 219 in the 2nd half, pretty close to what both Ruth and Gehrig had in 1927 (for the year Thome has an OPS+ of 175-that would be 3rd in the league if he qualified but he has only 335 PAs). His AVG-OBP-SLG since the break are .310-.450-.722.
Since the break the Twins' pitchers have given up just 39 HRs in 63 games while they gave up 92 in their first 88. I gave more details on their run last week. Scroll down to see some of those posts.
Update at 9:17 a.m.: Here are the OPS, OPS allowed and OPS differential for the 4 AL playoff teams in the 2nd half
Twins: .787-.690-.097
Yanks: .795-.733-.062
Rays: .737-.742-negative .005!
Rangers: .743-.696-.047
So the Twins clearly have been playing the best, although an easier schedule might have helped.
Monday, September 20, 2010
SABR Posts Link To Mark Kanter's Presentation On Home Field Advantage
Go to Does Extreme Home Field Advantage Exist?. The actual title might be "Why Do the Rockies Win More Than They Should at Home?" But I am not sure.
Saturday, September 18, 2010
Is Austin Jackson Getting Alot Of Infield Singles And Are They Partly Responsible For His High BABIP?
Jeff Passan at Yahoo mentions that Jackson has an historically high BABIP of .413 See Think you know baseball? No, you don’t.
It would be the highest since 1924. Jackson has a .161 AVG on balls in the infield according to Baseball Reference. But the league average is just .080. If we take half of his infield hits away, say 15, he then would be 16 for 191 on infield balls. That would lower his BABIP from 164/398 = .412 to 149/398 = .374. Still very high, but maybe not as historic.
He is fast with 10 3Bs this year as a RHB while stealing 24 with only 5 caught stealing. Maybe he beats out more grounders than average.
His average on hits to the outfield is .649 while the league average is .545. So he is above average here but not relatively as much as as in the infield. His GB/FB ratio is just about 2.22-1 while for the league it is about 1.23-1. Line drives are 27.3% of his non-bunt ABs while for the league it is 19.1%. His AVG on line drives is just about the league average, .722 vs. .725. So if you hit alot more line drives and you are fast, maybe you get a high BABIP. He strikes out 25.7% of the time while the league average is 17.5%. Maybe he just swings real hard, too.
Thursday, September 16, 2010
Is A Lower HR Allowed Rate A Big Reason For The Twins' Success In The 2nd Half?
The table below shows some stats for their pitching staff in the first half vs. the second half, with data coming from Baseball Reference. The numbers in the 2nd part of the table are all rates, with the stat being divided by PA.

Notice that their SO/BB ratio fell by 19%. If someone told you that this would happen, my guess is that you would have thought it would be bad news for the Twins. You can see that their SO rate is down and their BB rate is up (for those rates, I included HBP and IBBs in the rate). They have also allowed a higher single rate.
But there are big drop offs in 2Bs and HRs. A 45% drop in HR rate seems very large. They allowed 92 HRs in 88 games before the All-Star break and 33 in 57 games since the break. AVG and OBP did not change much. But SLG did, probably due to the lower rate on 2Bs and HRs (of course, fewer 2Bs might be the result of better fielding).
I don't know why the HR rate fell. Maybe more games at home, the opposition, the flyball rate, etc. Those are all just speculation.
The starters saw their AVG-OBP-SLG go from .282-.321-.454 to .252-.302-.362. A 92 point drop in SLG! But, the relievers saw the following change: .237-.296-.378 to .278-.339-.395. The starters saw their OPS fall .111 while the relievers had a .060 gain! In the 1st half, the starters faced 69.3% of the batters while in the 2nd it was 69.8%. So, although the relievers did worse and pitched the same relative amount in the 2nd half, the better performance all comes from the starters (although Duensing changed roles, becoming a starter).
Wednesday, September 15, 2010
July 15, 2010: The Twins Turned Into The 1927 Yankees
The Twins are 40-16 since the All-Star break. That is a .714 winning percentage. The same one the 1927 Yankees had. They were 110-44.
The Twins also did this without Justin Morneau. He has not played at all during this run. He played 81 games and had a WAR of 5.1, still tied for 8th best in the league right now (from Baseball Reference). His 179 OPS+ would be 2nd in the league to Miguel Cabrerra (181) if Morneau still qualified. Morneau had the following AVG-OBP-SLG: .345-.437-.618.
In the 2nd half, Jim Thome has had an OPS+ of 222. In 1927, Ruth had 226 and Gehrig had 221. Since the break, his AVG-OBP-SLG: .308-.444-.738. His OPS+ for the whole year is 173.
Joe Mauer has also picked it up, raising his OPS from .792 in the 1st half to .977 in the 2nd. One player who has seen increased playing time is Danny Valencia. He had only 58 AB in the 1st half with an OPS of .720 while in the 2nd he has had an OPS of .830 in 173 ABs. Another big jump comes from J. J. Hardy, who saw his OPS go from .607 to .837.
There were more details in yesterday's post on how the team performed in both halves.
But here are the ERAs of the Twins five starters, 1st half and 2nd half:
Pavano: 3.58-3.29
Baker: 4.87-4.03
Liriano: 3.86-2.41
Slowey: 4.64-3.47
Blackburn: 6.40-3.26
Brian Duensing made no starts in the first half. But 9 of his 11 games in the 2nd half were starts while compiling an overall ERA of 2.25. His OPS allowed as a starter is just .606, even better than as a reliever, which was .617.
Tuesday, September 14, 2010
Did The White Sox Blow It Or Did The Twins Win It?
I know it really isn't over yet, but the Twins have a 6 game lead. On July 20, the White Sox had a 3.5 game lead.
The Twins are 39-16 since the All-Star Break. If they had played .600 since then, the two teams would be tied. They were 46-42 prior to the All-Star break. Who could have predicted that they would play .700 since then, especially without Morneau? The Sox only went 30-26. That should have been enough to keep them in contention.
The Twins have allowed an OPS of .682 since then while the league average is .727. The Twins have allowed a .312 OBP and a .371 SLG while the average has been .323 & .404. Before the All-Star Break, they allowed an OPS of .745
The Twins batters saw their OPS jump from .762 pre All-Star to .779. So their OPS differential went from .017 to .097 before and after the break.
They have also beaten the White Sox 10-5 this year. If the White Sox were 7-8 vs. the Twins this year, they would only be two out. If they were to take 2 out of 3 in this upcoming series, they would only be 1 game out and the season series would finish at 9-9. So in a way, the Twins have just taken it away from the Sox by doing so well when they went head-to-head.
For their part, the White Sox hitters have had an OPS of .780 since the All-Star break while their pitchers have allowed a .735 OPS. A .045 differential is not bad. The relationship between OPS differential and winning pct is about
Pct = 1.25*OPSDIFF + .5
That would give the Sox a .556 differential and 31.25 wins. The Twins project out to .621 or 34.17 wins. In reality, the Twins have been 9.5 games better than the Sox in the 2nd half. The OSPDIFF says the teams' W-L record to be:
Twins 34.17-20.83
Sox 31.25-24.75
That makes the Twins 3.42 games better since the All-Star break. The difference could be that the Twins have made 25 fewer errors this year. Also, in the 2nd half, the White Sox OBP differential is only .007 while it is .033 for the Twins. Since OBP is more important than SLG, this could be the key.
In the 2nd half the Sox have outscored their opponents 284-244. The Twins have outscored their opponents 284-196. That gives the Sox a Pythagorean .575 pct or a 32.22-23.78 record. The Twins project out to a .677 pct. or a 37.26-17.74 record. That predicts that the Twins would have been about 5.5 games better than the Sox since the break.
This implies that the Twins might be winning some close games that the Sox are not. In fact, since the All-Star break, the Twins have a 4-1 record vs. the Sox in 1-run games. A quick "eye balling" of Baseball Reference shows the Sox to be 7-11 since the break in 1-run games while the Twins are 15-7. That is 6 games better, the lead the Twins have.
Sunday, September 12, 2010
Has Baserunning Helped The Rays This Year?
It looks like it has. They seem to be scoring more runs than their OBP and SLG would normally indicate. The following equation shows the relationship between team runs per game and OBP & SLG for all teams from 2007-09:
R/G = 11.595*SLG + 16.04*OBP - 5.52
The Rays have a .338 OBP & a .410 SLG. That predicts 4.66 runs per game yet they are actually scoring 5.11. That is .45 more than expected and the next highest positive differential is about .30 for the Padres
I then used an equation which included GDPs, SBs and CSs per game. It was
R/G = -0.0556*GDP - 0.182*CS + 0.105*SB + 11.19*OBP + 16.34*SLG - 5.43
That predicted that the Rays would score 4.71 runs per game, still well below their rate of 5.11. Then I added in 4 other baserunning variables: the % of runners on first who make it to third on a single (13%), bases taken, like on fly balls and wild pitches (BT), reaching on errors (ROE), and outs on base, like getting thrown out trying for an extra base (data from Baseball Reference). The last three were all per game.
Here is the equation:
R/G = -.025*GDP - .347*CS + .083*SB + 11*SLG + 14.59*OBP + 1.17*13% + .359*BT - .426*OOB + . 699*ROE - 5.48
Plugging in all of the Rays data would predict 4.87 runs per game. That jumps us alot closer to the 5.11. Adding in all of the baserunning data closes almost half the original gap of .45 between their actual runs and predicted runs.
I also tried breaking down OBP & SLG into cases of none on and runners on base (ROB). Here is the equation:
R/G = 7.83*ROBSLG + 9.26*ROBOBP + 3.66NONESLG + 8.53*NONEOBP - 6.12
Notice how SLG is twice as important with runners on than with none on. With none on, the Rays have an OBP & SLG of .322 & .396. With ROB, they have .357 & .429. Plugging all that in to the equation predicts 4.74 runs per game. That is .08 higher than the very first equation reported (4.65). So if we combined that with the findings from baserunning, we would probably get something over 4.87 and we have a good idea why the Rays are scoring so many runs this year.
Wednesday, September 8, 2010
Could A Person Watch Every Game In A League For A Whole Season?
With all the technology we have, it seems like it could be possible. Maybe a good writer would be willing to try this or someone who works at ESPN. In the AL, there are normally, at most, 7 games in a day. If you do alot of fast forwarding, you might be able to watch each game in an hour. So it would be like a full time job. You could blog abot it every day. Maybe even turn it into a book.
No one has ever done this before. A good writer might be able to tell a good story or be able to bring something new to baseball analysis. It could drive someone crazy, too. Then there are the inter-league games. If you were doing the AL, you would have to watch 14 games per day. I don't think I would be willing to try it and even if I could take a leave of absense from my teaching job, it would be tough.
When it comes to awards and all-star voting, in a way, no one is really qualified to vote, since no one sees every game. But maybe now it would be different. Maybe several writers could do this and then it would be fun to hear all their different viewpoints.
Sunday, September 5, 2010
Lost RBIs Found, Part 2
This another guest post by Tom Ruane. The first part was Lost RBIs Of Ruth, Gehrig, Others Discovered
Nearly two weeks ago, I sent out a note on several games from 1920 to 1949 in which teams scored at least three runs without an official RBI. As I pointed out at the time, some of these seemed to be legitimate cases where no RBI should have been credited, but most appeared to be oversights on the part of the official scorer. Simply put, they forgot to fill in the RBIs on the sheets they submitted. In addition to providing information on these games, I asked for help locating detailed accounts of some of these games.
I would like to thank Mark Pankin, Ron Antonucci, Keith Carlson and Ron Selter for their help in locating accounts of all of the games on the "missing" list. I would also like to apologize in advance if I forgot to thank anyone.
I also decided to extend my search for missing RBIs by looking at all games where a team scored two runs without being credited with an RBIs. As expected, many of these were cases where both runs scored on errors, wild pitches, steals of home and so on. Others reflect a different interpretation of what an RBI was (and I will have more to say on this subject in a later post). And other cases are once again games in which it appears that the official scorer forgot about RBIs.
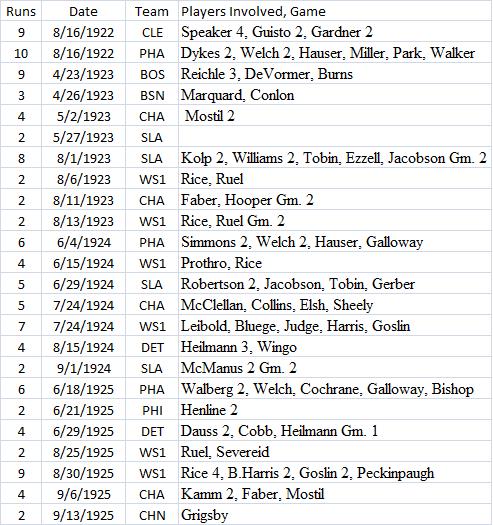
So here is an updated version of my earlier list, this time including those two runs games. Once again, the number before the date is the number of runs scored by the team in the game.


* - only source was newspaper box score
+ - missing a detailed account of the game
As you no doubt noticed, extending the search in this manner added a handful of new "missing" games:
1920-9-19(2) WS1 @ DET
1921-6-26 CIN @ SLN
1921-7-24 SLA V BOS
1922-6-27(1) BOS @ PHA
1923-5-27 SLA V CLE
1926-5-1 SLA V DET
1927-9-30 PHI @ BSN
Nearly two weeks ago, I sent out a note on several games from 1920 to 1949 in which teams scored at least three runs without an official RBI. As I pointed out at the time, some of these seemed to be legitimate cases where no RBI should have been credited, but most appeared to be oversights on the part of the official scorer. Simply put, they forgot to fill in the RBIs on the sheets they submitted. In addition to providing information on these games, I asked for help locating detailed accounts of some of these games.
I would like to thank Mark Pankin, Ron Antonucci, Keith Carlson and Ron Selter for their help in locating accounts of all of the games on the "missing" list. I would also like to apologize in advance if I forgot to thank anyone.
I also decided to extend my search for missing RBIs by looking at all games where a team scored two runs without being credited with an RBIs. As expected, many of these were cases where both runs scored on errors, wild pitches, steals of home and so on. Others reflect a different interpretation of what an RBI was (and I will have more to say on this subject in a later post). And other cases are once again games in which it appears that the official scorer forgot about RBIs.
So here is an updated version of my earlier list, this time including those two runs games. Once again, the number before the date is the number of runs scored by the team in the game.


* - only source was newspaper box score
+ - missing a detailed account of the game
As you no doubt noticed, extending the search in this manner added a handful of new "missing" games:
1920-9-19(2) WS1 @ DET
1921-6-26 CIN @ SLN
1921-7-24 SLA V BOS
1922-6-27(1) BOS @ PHA
1923-5-27 SLA V CLE
1926-5-1 SLA V DET
1927-9-30 PHI @ BSN
Wednesday, September 1, 2010
Update on Blue Jays and Astros Offenses
My first post on this was Astros Offense On Record Setting Low Pace. Right now their OPS is .663 and the league average is .727. So .663/.72 = .912, giving them a relative OPS of about 91. That would put them in the bottom 25 since 1993.
The Astros have an OPS+ of 78 according to Baseball Reference. It takes park effects into effect as well as the league average (it is calculated a little differently than above). That is last in the NL this year. The Pirates are next lowest at 81. The lowest team OPS+ I found going all the way back to 1920 was 69 for the 1920 Philadelphia A's. But the Mariners are even lower now than the Astros with a 77. The last time any team finished a season below 80 was in 2004, the Expos (78) and the Diamondbacks (77).
The Blue Jays have an isolated power (ISO) of .205 since their SLG is .455 and their AVG is .250. That is about the same as the all-time record of .205 by the 1997 Mariners. Relative to the league average, it would be the 6th highest since 1900, at 139 (.205/.148 = 1.39). The league ISO in the AL this year is .148. The 1927 Yankees are the highest in relative ISO at 153. The Jays ISO is .233 at home and .180 on the road.
My first post on this was Blue Jays On Record Power Pace.
Subscribe to:
Posts (Atom)